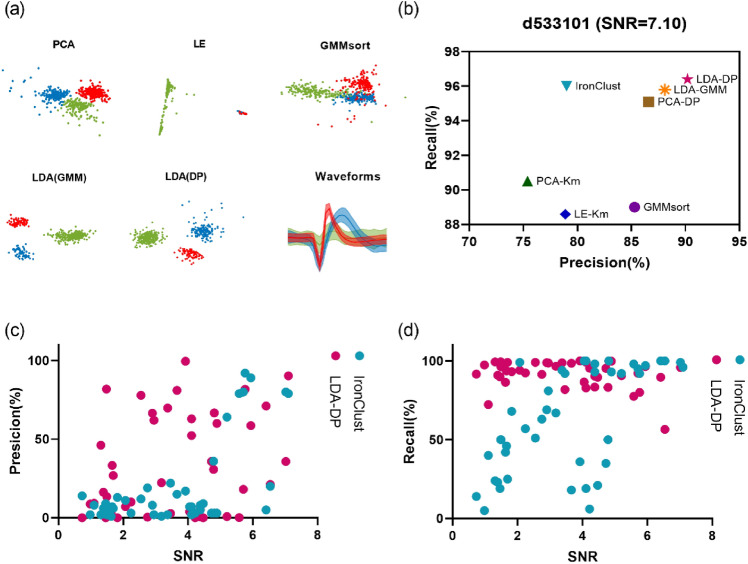
Figure 6.
The sorting results on the in-vivo Dataset B when comparing 6 spike sorting algorithms. (a) Two-dimensional feature subspace extracted by each method. The data points are colored according to the sorting results, in which red, green and blue represent cluster 1, cluster 2 and cluster 3 respectively. The waveform panel shows the average spike waveforms of three clusters obtained by LDA-DP, and the shaded part represents the standard deviation. (b) The precision rate and the recall rate obtained according to partial ground truth on dataset d533101 in HC1. (c,d) The precision rate and recall rate comparison with regard to SNR on all the 43 datasets in Dataset B.

