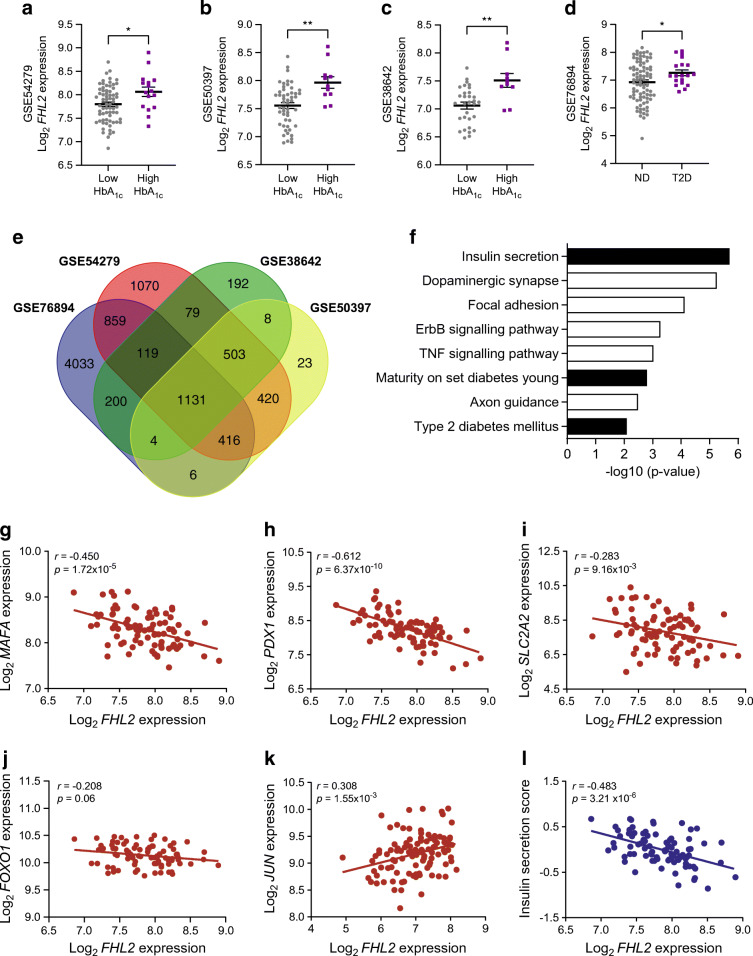
Fig. 1.
FHL2 expression shows a negative correlation with the insulin secretion pathway in human pancreatic islets. (a–d) FHL2 expression (Log2) in pancreatic islets of individuals with low (grey) or high (purple) HbA1c levels in datasets GSE38642 (n=41; a), GSE54279 (n=84; b) and GSE50397 (n=62; c), and FHL2 expression in islets of non-diabetic individuals (grey) and individuals with type 2 diabetes (purple) in dataset GSE76894 (n=103; d). (e) Venn diagram showing the number of genes that significantly correlate with FHL2 expression across all datasets. (f) Pathway analysis of the 1131 genes significantly correlated with FHL2 expression in all four datasets sorted by p value including epidermal growth factor (ErbB) and TNF signalling pathways. (g–k) Expression correlation of key insulin-secretory genes MAFA (g), PDX1 (h), SLC2A2 (i), FOXO1 (j) from dataset GSE54279 and JUN from dataset GSE76894 (k) to FHL2 expression. (l) Negative correlation of insulin secretion pathway signature score and FHL2 expression in the GSE54279 dataset. Data are presented as mean ± SEM; *p<0.05 and **p<0.01. See ESM Fig. 1a–e for similar data from the other three datasets. ND, non-diabetic; T2D, type 2 diabetes

