FIG. 7.
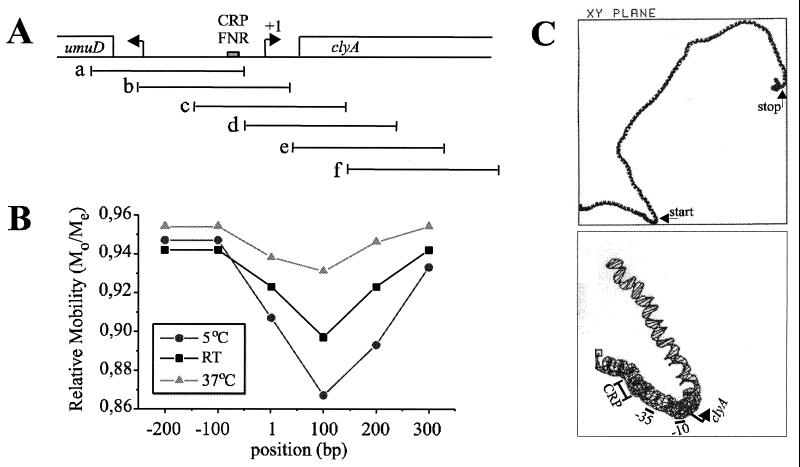
(A) Schematic drawing of the umuD clyA intercistronic region. The DNA site for CRP-FNR is shown as a grey box, and transcriptional start points for clyA and umuD are indicated by horizontal arrows. The extents of the overlapping DNA fragments generated by PCR, which were used in DNA bending analysis experiments, are shown as horizontal lines. (B) Mapping of the center of the sequence directed bend. Mos as distances from the top of the gel were divided by the Me for each fragment. The Mo/Me value was plotted against the center position (in base pairs) of the DNA fragment. RT, room temperature. (C) The upper panel shows a computer projection analysis of 1,402 bp from the clyA DNA region, which includes the 912-bp clyA coding sequence with 372 bp upstream of the clyA start codon and 118 bp downstream of the clyA stop codon. The positions of the translational start and stop codons of clyA are indicated by arrows. The lower panel shows an enlargement of the predicted curvature pattern in the clyA promoter region from position 200 to 400. The positions of the predicted CRP binding site (−72 to −51), the −35 sequence (−35 to −30), the −10 sequence (−12 to −6), and the transcriptional start point (+1) are indicated.

