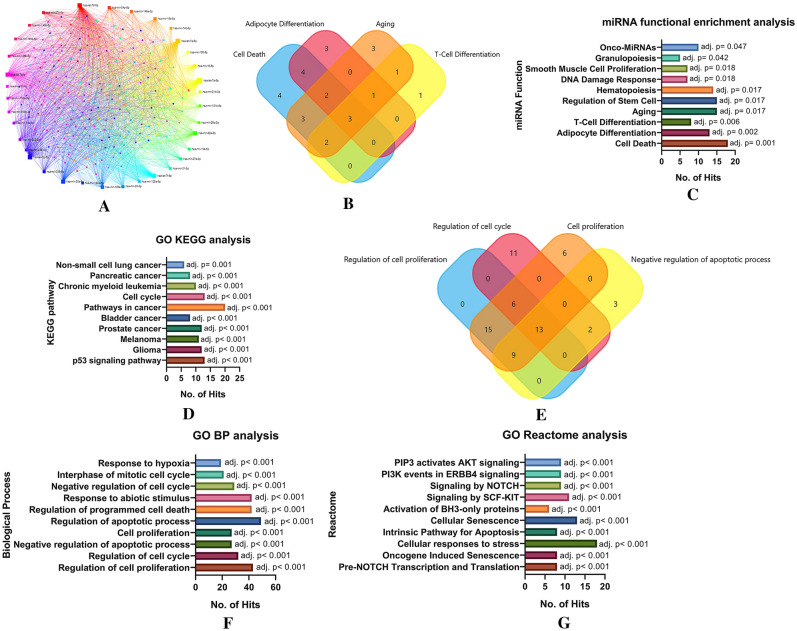
Fig. 10.
A miRNA –mRNA interaction network of highly expressed miRNAs in exosomes and gene ontology (GO) analysis using the miRnet database. B Venn diagrammatic representation of miRNAs distribution in functional enrichment analysis. C miRNA functional enrichment analysis of highly expressed miRNAs with top 10 function class having highly significant p value. D GO KEGG analysis of interacting nodes with highly expressed miRNAs with top 10 pathway class having highly significant p value. E Venn diagrammatic representation of interacting nodes distribution in biological process analysis. F GO biological process analysis of interacting nodes with highly expressed miRNAs with top 10 pathway class having highly significant p value; and G GO Reactome analysis of interacting nodes with highly expressed top 10 miRNAs having highly significant p values

