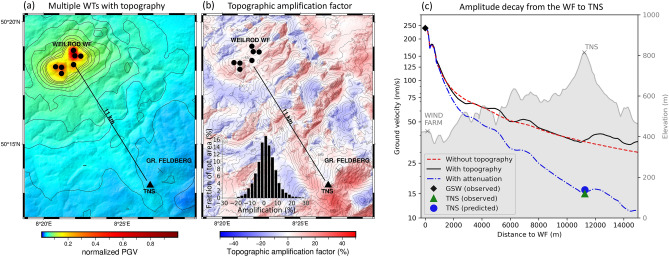
Figure 5.
Maps of the average peak ground velocity (PGV) with topography (a) and the amplification factor due to topography (b) for all seven WTs in the Weilrod WF. On average, the amplification at TNS due to topography is about 9%. The PGVs along a straight line between the centre of the WF (station GSW) and permanent station (TNS) are extracted and calibrated with respect to the measured PGVs at the temporary station (GSW) within the WF (c). The measured amplitude at TNS is finally predicted including attenuation in the model. The distribution of the obtained amplification factor in the model domain ranges from − 20 to 30% (histogram in b). The amplitudes in (a) are normalized to the maximum amplitude that occurs and is therefore 1 at the sources. Note: The contour lines in (b) are based on the digital elevation model and the left y-axis in (c) is logarithmic.

