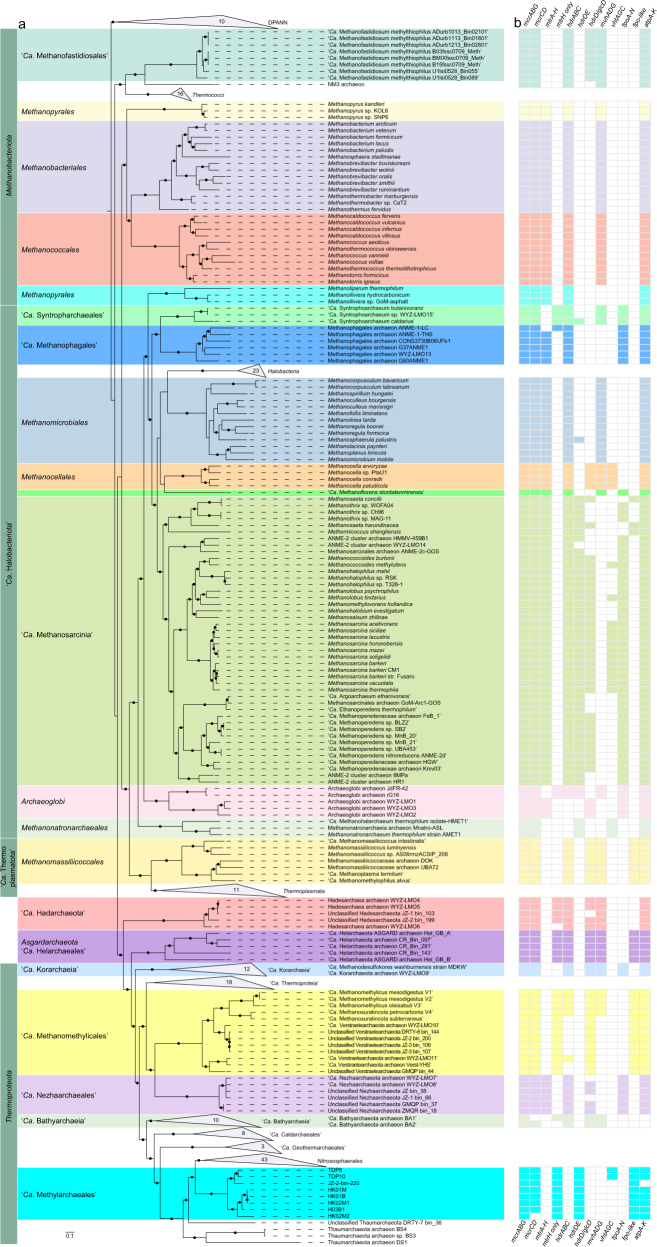
Fig. 1. Genome tree and distribution of genes related to methane metabolism.
a Maximum-likelihood tree of a concatenated set of 122 archaeal-specific marker genes inferred with IQTREE (LG + C60 + F + G and 1000 ultrafast bootstrapping), rooted with the DPANN superphylum, showing the placement of the “Ca. Methylarchaeales” (in cyan) relative to 321 archaeal genomes. Ultrafast bootstrap (BS) value ≥95 are represented by black circles. Representative mcr-containing archaeal lineages available in public databases are included and expanded in the tree. The lineages assigned to the Euryarchaeota (recently reclassified as a superphylum consisting of three separate phyla: “Ca. Halobacteriota”, Methanobacteriota, and “Ca. Thermoplasmatota”) are classified at the order level. b The phylogenetic distribution of key methane metabolism related genes. For mtrA-H, fpoA-N, fpo-like, and atpA-K, they were regarded as present if ≥80% of the subunit genes constituting these complexes were identified. For other complexes, they were regarded as present only when all subunit genes for these complexes were found.

