Figure 2.
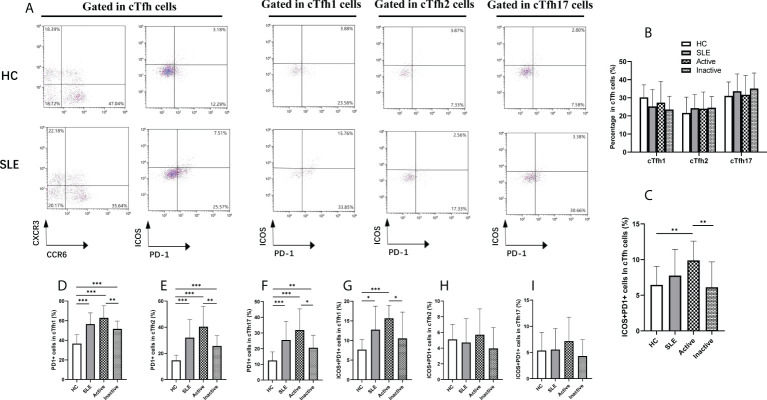
Changes of cTfh cell subsets in SLE patients. (A), Analysis of cTfh cell subsets by flow cytometry; (B), Percentage of cTfh1, cTfh2 and cTfh17 cells in cTfh cells from SLE patients: cTfh1 (CXCR3+CCR6- cTfh), cTfh2 (CXCR3-CCR6- cTfh) and cTfh17 (CXCR3-CCR6+ cTfh); (C), Percentage of ICOS+PD-1+ cTfh cells in cTfh cells from SLE patients; (D–F), Percentage of PD-1+ cTfh1, PD-1+ cTfh2, PD-1+ cTfh17 cells in cTfh cells from SLE patients; (G–I), Percentage of ICOS+PD-1+ cTfh1, ICOS+PD-1+ cTfh2, ICOS+PD-1+ cTfh17 cells in cTfh cells from SLE patients. Horizontal lines show the median. Statistically significant differences are indicated by the P value, *P<0.05;**P<0.01;***P<0.001.

