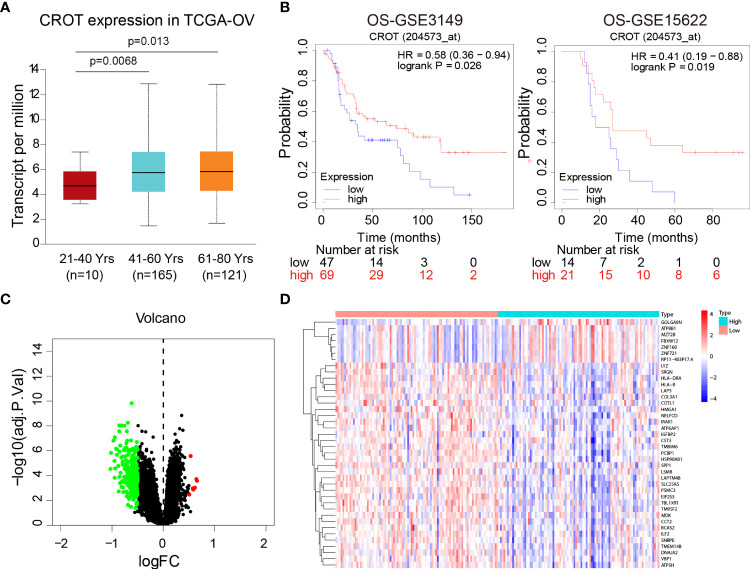
Figure 2.
Association of CROT expression with prognosis. (A) Association of CROT expression with ages of OC patients based on the data from the TCGA-OV dataset using the UALCAN database. (B) The correlation of CROT expression with the overall survival (OS) of patients with OC was analyzed by the Kaplan-Meier plotter. The data were from GSE3149 and GSE15622 datasets. (C, D) Co-expressed genes with CROT presented in volcano map and heatmap. The data were from the GSE26712 dataset (logFC>0.5, p<0.05). TCGA-OV, The Cancer Genome Atlas ovarian cancer.

