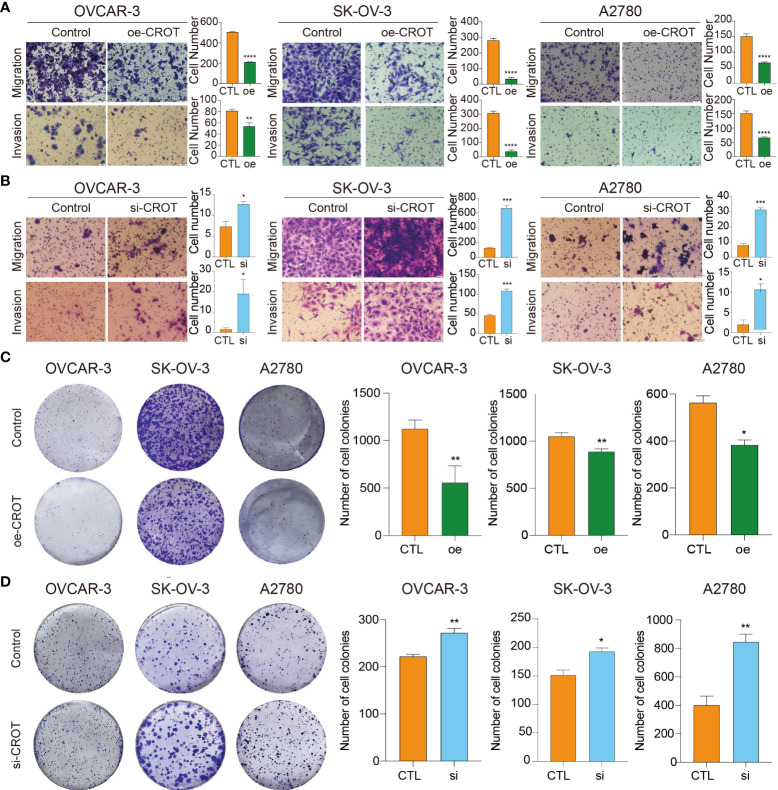
Figure 4.
Detection of migration, invasion, and colony formation in OVCAR3, SKOV3, and A2780 cells. (A) Detection of cell migration and invasion after CROT-overexpressing plasmid (oe-CROT) transfection for 48 h. (B) Detection of cell migration and invasion after CROT-siRNA (si-CROT) transfection for 48 h. (C) Detection of colony formation after CROT-overexpressing plasmid (oe-CROT) transfection for 2 weeks. (D) Detection of colony formation after CROT-siRNA (si-CROT) transfection for 2 weeks. Histograms show the statistical analyses. Assays were repeated at least three times. Data presented as mean ± SEM. *P <0.05; **P < 0.01; ***P < 0.001; ****P < 0.001; oe, overexpression of CROT; si, CROT-siRNA; CTL, negative control.

