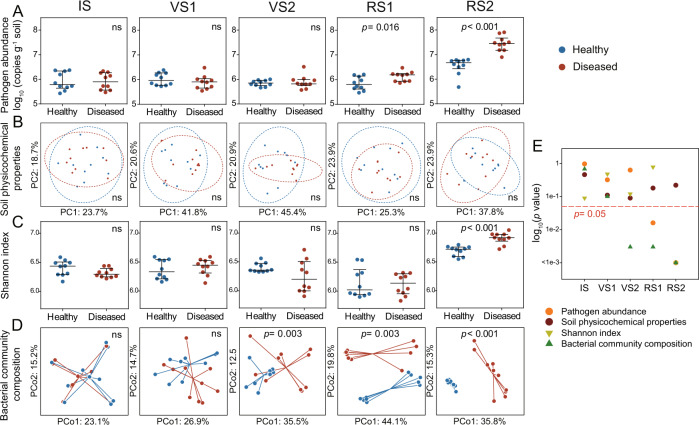
Fig. 3. The initially uniform soil microbiome rapidly diverges into distinct states with implications for plant health.
Dynamics of R. solanacearum abundance (A), soil physicochemical properties (B), Shannon index (C), and bacterial community composition D associated with plants classified at the end of the experiment into healthy (no to low pathogen density, no symptoms) and diseased (high pathogen density and clear wilt symptoms) plant individuals. Soil samples associated with ten plants of each disease outcome were randomly selected. IS initial stage, VS1 vegetative stage 1, VS2 vegetative stage 2, RS1 reproductive stage 1, RS2 reproductive stage 2. E Statistical significances (log-transformed p values) between the healthy and diseased plants with soil physicochemical properties, pathogen abundance, Shannon index, and bacterial community composition as response variables. Bacterial alpha and beta diversity (C, D) were estimated using the smallest sample depth (23, 639 reads). A, C pairwise comparisons (p values) between the two health states classified at the end of the experiment were conducted using the Student’s t test with pathogen density and Shannon index as response variables, respectively. B Physicochemical properties of rhizosphere soil (EC, pH, NH4+-N, NO3−-N, AP, TC, TN, DOC, DON, and CN ratio) were ordinated using principal component analysis (PCA). Ellipses indicate 95% confidence intervals around the clusters of healthy and disease plants. D Bacterial community composition was ordinated using principal coordinates analysis (PCoA) based on Bray–Curtis distances. Individual points are connected by half-lines radiated from the centroid. Statistical differences in soil physicochemical properties and bacterial community composition associated with the disease outcome (B, D) were determined by PERMANOVA. E The red dashed line indicates p = 0.05.

