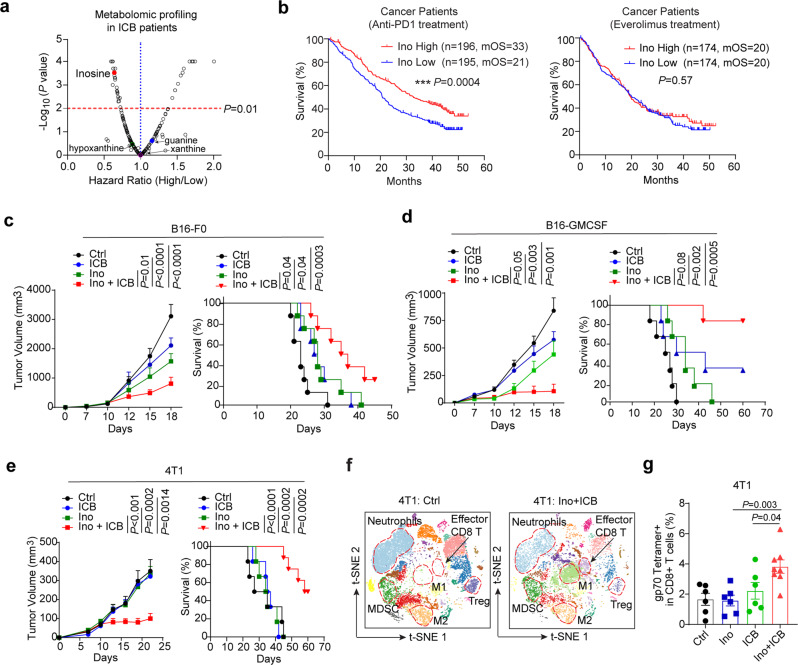
Fig. 1. Inosine overcomes resistance to immunotherapy by inflaming tumour immune microenvironment.
a Volcano plot showing the hazard ratios (HR) of high/low levels of serum metabolites (n = 202, represented as points, high and low are stratified by the median of each metabolite) in CheckMate 025 renal cell carcinoma (RCC) patients with nivolumab (anti-PD1 Ab) treatment (n = 392). Overall survival is used as a Cox proportional hazards model. A cutoff at P = 0.01 is shown as a horizontal line and HR (high/low) = 1 is shown as a vertical line (HR: high/low <1 indicates that a high level of a metabolite is a benefit for ICB patients). b Kaplan–Meier plot of overall survival in RCC patients with nivolumab (anti-PD1 Ab) (High, n = 196, mean OS = 33; Low, n = 195, mean OS = 21) or everolimus (mTOR inhibitor) (High, n = 174, mean OS = 20; Low, n = 174, mean OS = 20) grouped by the inosine level at the median of baseline level. c–e Tumour volume and survival analysis of B16-F0 (c, n = 5), B16-GMCSF (d, n = 5), or 4T1 (e, n = 6) tumour-bearing mice treated with IgG2a (Ctrl), 400 mg/kg of Inosine (Ino), anti-CTLA4 + anti-PD1 (ICB) or ICB + Inosine (Ino + ICB) treatment. f tSNE plot of single-cell RNA sequencing of CD45+ immune cells from 4T1 tumours treated with Ctrl (n = 16199 cells) or Ino+ICB treatment (n = 9842 cells). g The frequency of gp70-specific CD8+ T cells in 4T1 tumour with Ctrl (n = 6), Ino (n = 6), ICB (n = 6), or Ino+ICB (n = 8) treatment for 15 days. Data are presented as Mean ± s.e.m. Statistical significance was determined by one-way ANOVA and Tukey test for multiple comparisons (tumour sized of c–e, g) or log-rank (Mantel–Cox) test (survival analysis of b–e). Source data are provided as a Source Data file.

