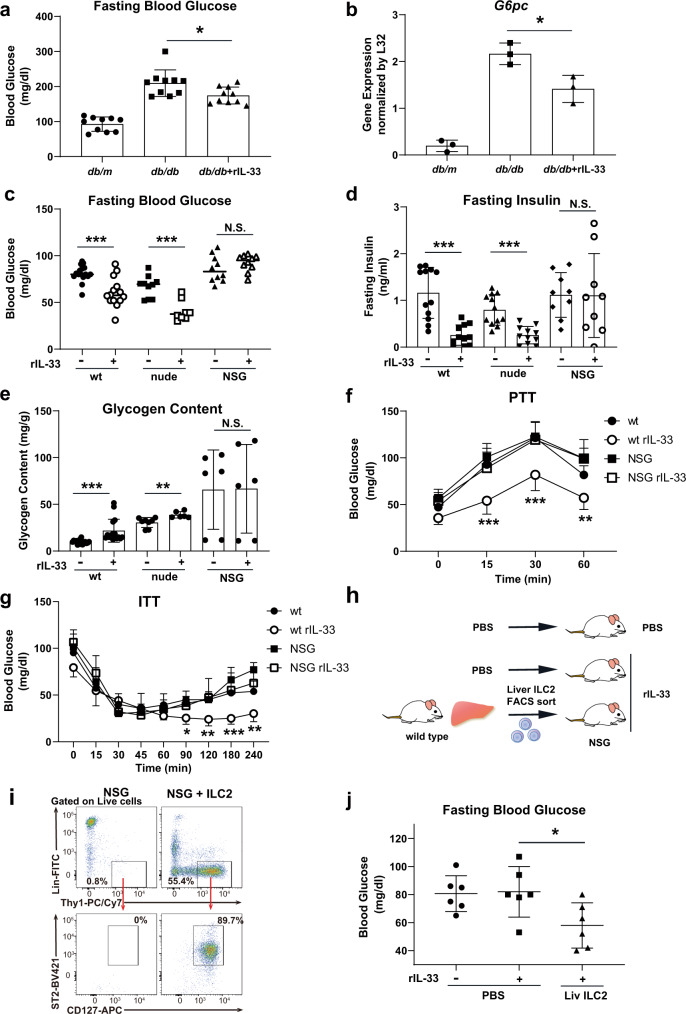
Fig. 1. Recombinant IL-33 (rIL-33) injection exerts a blood glucose-lowering effect by limiting gluconeogenesis, which may be mediated by liver group 2 innate lymphoid cells (ILC2).
a Fasting blood glucose levels in control (db/m) and db/db mice after 5 consecutive days of intraperitoneal phosphate-buffered saline (PBS) (db/db) or rIL-33 injections (db/db + rIL-33). The data are presented as the mean ± SD; n = 10 per group. b G6pc mRNA expression in liver tissues from control and db/db mice after 5 days of PBS or rIL-33 injections. The relative expression levels (normalized to L32) are shown with the SD (n = 3 per group). c, d, e Fasting blood glucose levels (c), fasting insulin levels (d), and liver glycogen contents (e) in wild-type (wt), nude and NOD/Scid/Il2Rγnull (NSG) mice after 5 days of PBS or rIL-33 injections (wt rIL-33[-]: n = 16, wt rIL-33[+]: n = 14, nude rIL-33[-]: n = 10, nude rIL-33[+]: n = 8, NSG rIL-33[-]: n = 10, and NSG rIL-33[+]: n = 10 in c; wt rIL-33[-]: n = 12, wt rIL-33[+]: n = 11, nude rIL-33[-]: n = 12, nude rIL-33[+]: n = 11, NSG rIL-33[-]: n = 9, and NSG rIL-33[+]: n = 9 in d; wt rIL-33[-], wt rIL-33[+], nude rIL33[-], nude rIL33[+]: n = 8, NSG rIL-33[-], and NSG rIL-33[+]: n = 6 in e). f, g Blood glucose levels measured by the pyruvate tolerance test (wt, wt rIL-33, NSG: n = 7, NSG rIL-33: n = 6). f, g Blood glucose levels measured by the pyruvate tolerance test (wt, wt rIL-33, NSG: n = 7, NSG rIL-33: n = 6) (f) and insulin tolerance test (0.075 U/kg body weight insulin, wt: n = 8, wt rIL-33: n = 5, NSG: n = 7, NSG rIL-33: n = 5) (g) in wt and NSG mice were evaluated after 5 days of PBS or rIL-33 injections. h Schema of the transfer experiment. Briefly, NSG mice were intravenously injected with PBS or cultured liver ILC2s, and their fasting blood glucose levels were evaluated 5 days after injection with rIL-33. i Gating and frequency of Lin-Thy1+CD127+ST2+ ILC2s in the liver tissues of rIL-33-treated NSG mice with or without liver ILC2 transfer. A representative figure is shown (n = 5 per group). j Fasting blood glucose levels in NSG mice with or without liver ILC2 transfer (n = 6 per group). Unpaired one-sided Student’s t-test. *P < 0.05; **P < 0.01; ***P < 0.001. Each bar and its error bars represent the mean ± SD.

