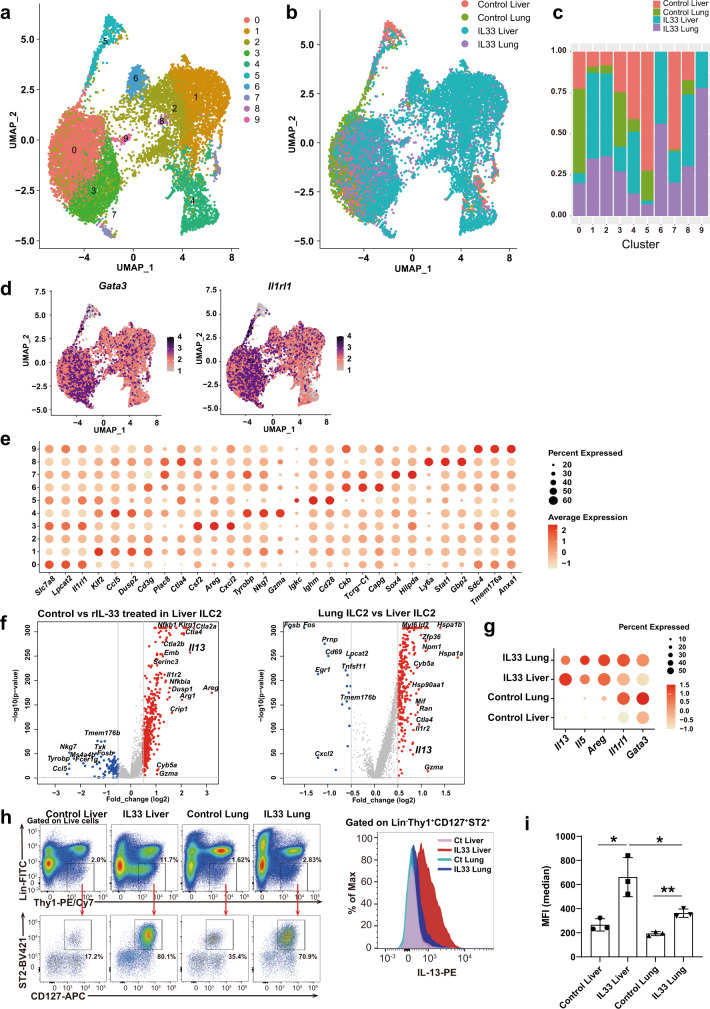
Fig. 3. scRNA-seq reveals that liver group 2 innate lymphoid cells (ILC2) highly express Il13, which may contribute to the blood glucose-lowering effect of IL-33.
a–i Liver and lung ILC2s were sorted from wild-type BALB/c mice intraperitoneally (i.p.) injected with phosphate-buffered saline (PBS) (control) or recombinant IL-33 (rIL-33) for 5 days. ILC2s from each of the four groups were profiled by droplet-based scRNA-seq. a, b The scRNA-seq data (n = 14,026 single ILC2s) across all four groups of ILC2s are shown as nonlinear representations of the top 50 principal components; the cells are colored according to uniform manifold approximation and projection (UMAP)-based clusters (a) or according to treatment and tissue type (b). Subclustering of ILC2s was performed with a resolution of 0.5. c Proportions of the clusters within each group as defined by treatment condition and tissue source. d UMAP plots showing the expression of the innate lymphoid cell (ILC) markers Gata3 and Il1rl1 in all ILC2 samples. e Dot plot showing the differentially expressed genes (DEG) in each cluster as defined by the FindAllMarkers function. f Volcano plots showing the DEGs between PBS-treated liver and rIL-33-treated liver samples (left) or between rIL-33-treated liver and rIL-33-treated lung samples (right). g Expression levels of representative Gata3 downstream genes, as grouped by treatment and tissue. h Gating for Lin-Thy1+CD127+ST2+ ILC2s (left) and frequencies and fluorescence intensities of IL-13 in liver and lung ILC2s from PBS- or rIL-33-treated mice (right) (n = 3 per group). i Mean fluorescence intensity (MFI) of IL-13 in ILC2s in each group (mean ± SD, n = 3). Unpaired one-sided Student’s t-test. *P < 0.05; **P < 0.01; ***P < 0.001.

