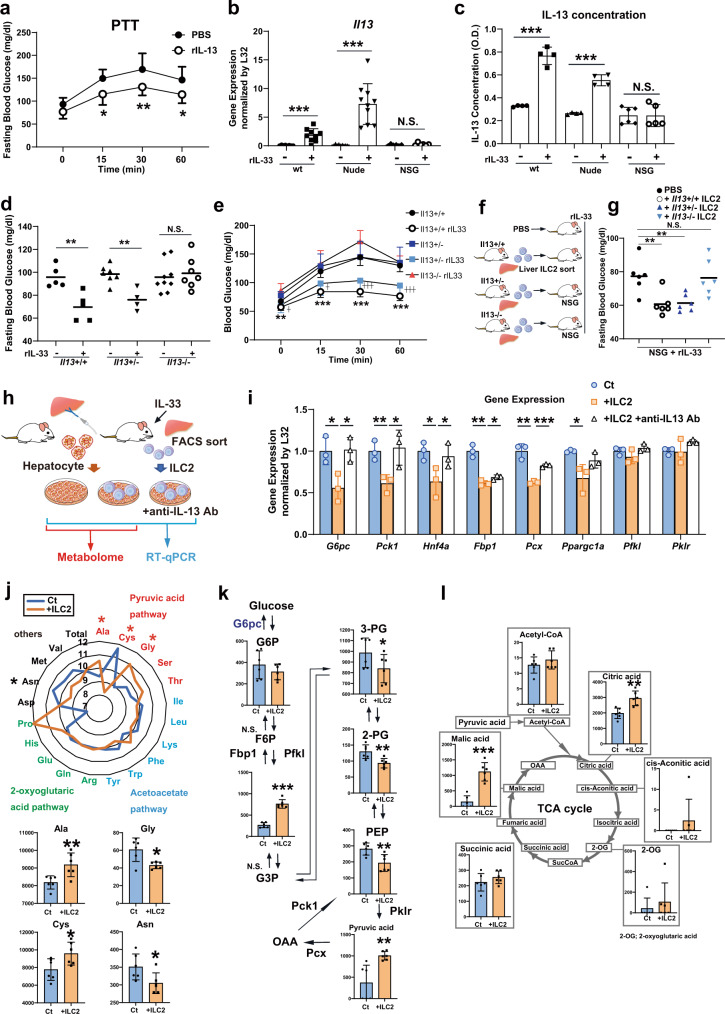
Fig. 4. Liver group 2 innate lymphoid cell (ILC2)-derived IL-13 directly suppresses gluconeogenesis in hepatocytes.
a Blood glucose levels in wild-type (wt) mice treated with phosphate-buffered saline (PBS) or IL-13 as measured by the pyruvate tolerance test (PTT) (n = 8 per group). b, c Il13 expression levels in liver tissue (normalized to L32) (b) and serum IL-13 concentrations (c) in wt, nude, and NOD/Scid/Il2Rγnull (NSG) mice intraperitoneally (i.p.). injected with PBS or recombinant IL-33 (rIL-33) for 5 consecutive days (wt rIL-33[-]: n = 8, wt rIL-33[+]: n = 9, nude rIL33[-]: n = 9, nude rIL33[+]: n = 10, NSG rIL-33[-] n = 6, and NSG rIL-33[+]: n = 6 in b; wt rIL-33[-]: n = 4, wt rIL-33[+]: n = 4, nude rIL33[-]: n = 4, nude rIL33[+]: n = 4, NSG rIL-33[-] n = 6, and NSG rIL-33[+]: n = 5 in c). d, e Fasting blood glucose (d) and blood glucose levels as measured by PTT (e) in Il13+/-, Il13+/- and Il13-/- mice after 5 days of rIL-33 injection (Il13+/+rIL-33[-]: n = 5, Il13+/+rIL-33[+]: n = 5, Il13+/-rIL-33[-]: n = 7, Il13+/-rIL-33[+]: n = 4, Il13-/- rIL-33[-]: n = 9 and Il13-/- rIL-33[+]: n = 7 in (d), Il13+/+rIL-33[-]: n = 7, Il13+/+rIL-33[+]: n = 5, Il13+/-: n = 4, Il13+/-rIL-33: n = 7 and Il13+/-rIL-33: n = 6 in e). f Schema of the experiment. PBS, liver ILC2s from Il13+/- mice or liver ILC2s from Il13-/- mice were injected intravenously into NSG mice. rIL-33 was i.p. injected for 5 consecutive days, and fasting blood glucose levels were measured after 3 and 5 days. g Fasting blood glucose levels in NSG mice without ILC2 transfer and with Il-13+/-, Il-13+/- or Il-13-/- liver ILC2 transfer at days 3 and 5 (n = 3). h Experimental schema for coculture and subsequent real-time quantitative PCR (RT–qPCR) and metabolome analysis. After 6 h of coculture with ILC2s, the hepatocytes were used for RT–qPCR and metabolomic analysis. i RT–qPCR analysis of gluconeogenesis-related genes in primary hepatocytes cocultured with ILC2s (Ct: control hepatocytes, +ILC2: hepatocytes cocultured with ILC2s, + ILC2 + anti-IL13 Ab: hepatocytes cocultured with ILC2s in the presence of an anti-IL-13 antibody; n = 3 per group). j, k, l Metabolomic analysis of primary hepatocytes after coculture with ILC2s (Ct: control hepatocytes, +ILC2s: hepatocytes cocultured with ILC2s; n = 6 per group). j Amino acid metabolites categorized into the pyruvic acid pathway, acetoacetate pathway, 2-oxoglutaric acid pathway and others. k Metabolites in the gluconeogenesis-related pathway. (G6P; glucose 6-phosphate, F6P; fructose 6-phosphate, F1,6P; fructose 1,6-diphosphate, G3P; glyceraldehyde 3-phosphate, 3-PG; 3-phosphoglyceric acid, PEP; phosphoenolpyruvic acid, OAA; oxaloacetate, Pklr; pyruvate Kinase L/R, Pcx; pyruvate carboxylase). l Metabolites in the tricarboxylic acid (TCA) cycle. Unpaired one-sided Student’s t-test. *P < 0.05; **P < 0.01; ***P < 0.001. Each bar and its error bars represent the mean ± SD.

