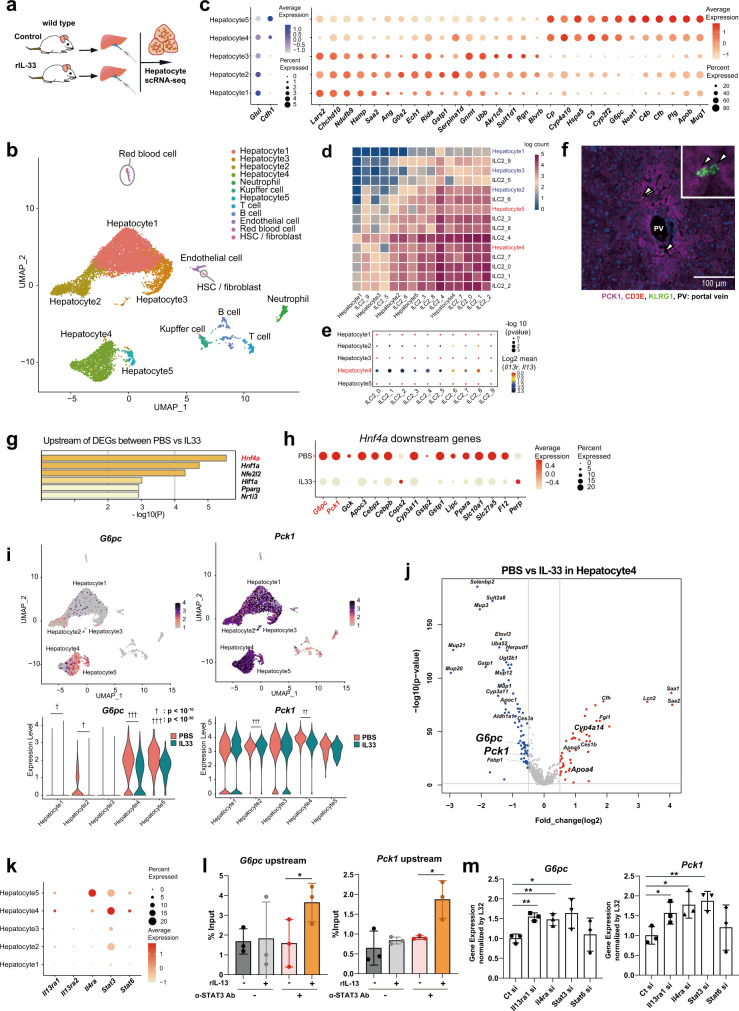
Fig. 5. IL-33 suppresses gluconeogenesis in hepatocytes, especially in the cluster that most significantly interacts with liver group 2 innate lymphoid cells (ILC2).
a Schema of the experiment. Hepatocytes were isolated from phosphate-buffered saline (PBS)- and recombinant IL-33 (rIL-33)-injected mice, and then subjected to scRNA-seq analysis. b scRNA-seq data (n = 11,327 single cells from the liver) for PBS and rIL-33-treated livers, shown as nonlinear representations of the top 50 principal components; the cells are colored based on uniform manifold approximation and projection (UMAP)-based cell clusters. c Dot plot showing the expression of zonation markers (Glul and Cdh1, left) and differentially expressed genes (DEG, right) in each hepatocyte cluster (n = 10,186 hepatocytes). d, e Interaction analysis using CellPhoneDB. Interaction heatmap plotting the total number of receptor and ligand interactions for the indicated cell clusters (d). Dot plot showing the results for the IL13-IL-13R interactions with the corresponding P-values and mean expression levels of IL-13 in ILC2s and IL13R in hepatocytes (e). f Representative image of immunofluorescence of PCK1-positive hepatocytes and ILC2s (CD3E-KLRG1 + ). PCK1: magenta, CD3E: red, KLRG1: green, nucleus (DAPI): blue. In total, 24 locations were observed in 5 independent mice with IL33 treatment. g Enriched genes upstream of the DEGs identified between the PBS and rIL-33 groups. h The dot plot shows the expression of genes downstream of Hnf4a, including G6pc and Pck1, in all hepatocytes. i UMAP plots (upper panel) and violin plots (lower panel) showing G6pc and Pck1 expression in all hepatocytes. j Volcano plots showing the DEGs between the PBS and IL-33 groups in Hepatocyte4 cells. Upregulated (red) and downregulated (blue) genes in the rIL-33-treated group. k Dot plot showing IL13 receptor subunit (Il13ra1, Il13ra2 and Il4ra) and Stat3/6 expression. The expression levels of Il13ra1 and Stat3 were elevated in Hepatocyte4. l STAT3 binding to the upstream regions of the G6pc and Pck1 genes was assessed by chromatin immunoprecipitation (ChIP) with quantitative PCR (qPCR) (n = 3 per group). m Primary hepatocytes were transfected with small interfering RNAs (siRNAs), and 48 h later, they were subjected to RT–qPCR for G6pc or Pck1 (n = 3 per group). Unpaired one-sided Student’s t-test. *P < 0.05; **P < 0.01; † < 10−10; †† < 10−20; ††† < 10−30.

