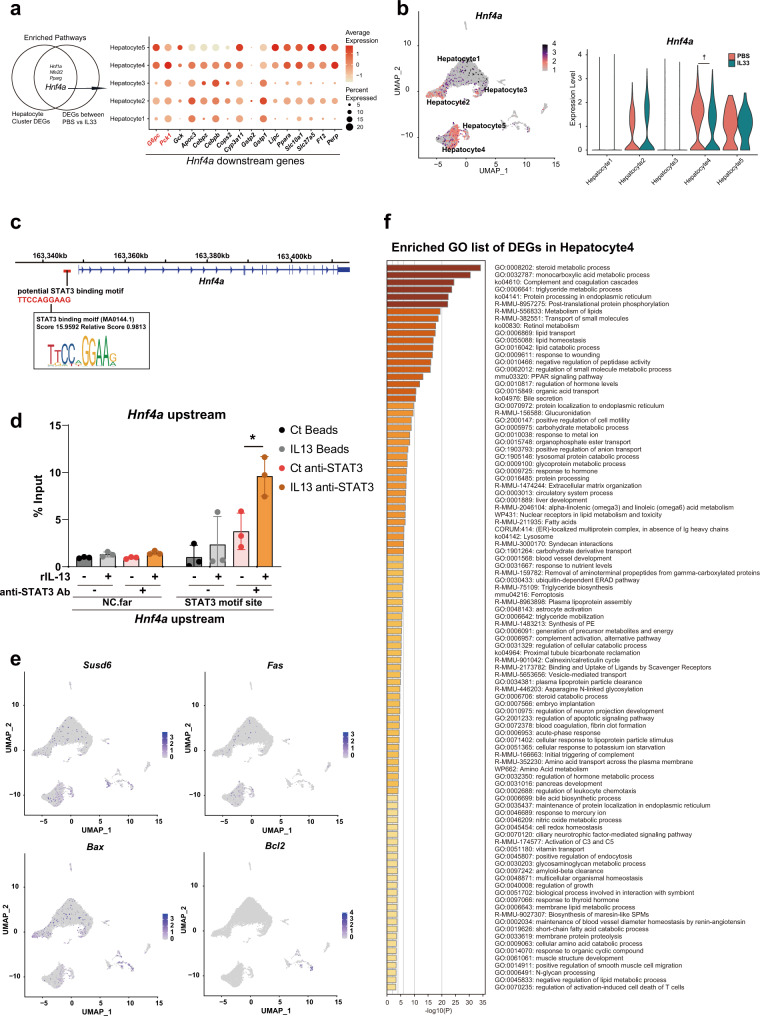
Fig. 6. IL-13 suppresses the expression of gluconeogenic enzymes via Stat3 signaling.
a Venn diagram showing common upstream genes (Hnf4a, Hnf1a, Nfe2l2, and Pparg) of differentially expressed genes (DEG) identified by comparing clusters or treatment conditions (left panel). Dot plot showing gene expression downstream of Hnf4a in each cluster (right panel). b Uniform manifold approximation and projection (UMAP) plots (left panel) and violin plots (right panel) showing Hnf4a expression. c Potential STAT3 binding sites upstream of Hnf4a are shown with the genomic DNA sequence and with the motif ID, score, and relative scores analyzed by the JASPAR database. d STAT3 binding to the upstream regions of the Hnf4a gene was assessed by chromatin immunoprecipitation (ChIP) with quantitative PCR (qPCR) (n = 3 per group). e UMAP plots showing the expression of cell death markers (Susd6, Fas, Bax and Bcl2). f Enriched Gene Ontology (GO) term list of DEGs in the Hepatocyte4 cluster. Unpaired one-sided Student’s t-test. *P < 0.05; † < 10−10. Each bar and its error bars represent the mean ± SD.

