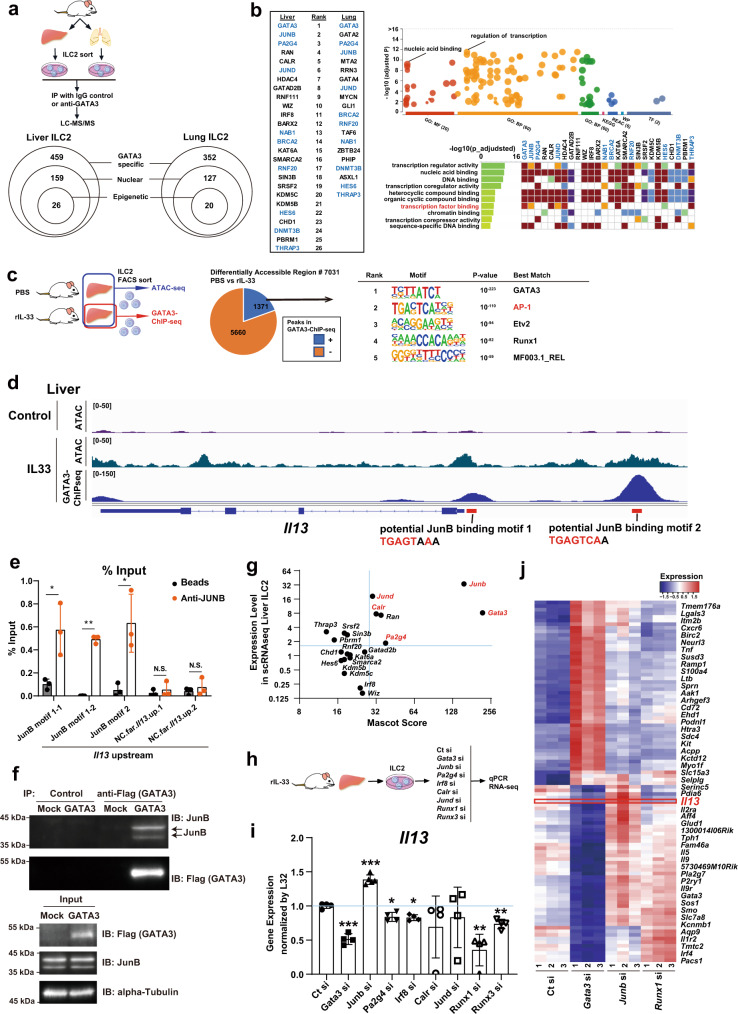
Fig. 7. AP-1 family members bind to GATA3 in liver and lung group 2 innate lymphoid cells (ILC2) and suppress GATA3 function to induce Il13 expression.
a Experimental schema. Sorted liver and lung ILC2s were cultured and then subjected to immunoprecipitation with an IgG control or anti-GATA3 antibody and then to liquid chromatography–mass spectrometry/mass spectrometry (LC –MS/MS) analysis. The Mascot score was evaluated, and GATA3-specific interacting proteins were identified. b List of GATA3-specific nuclear and epigenetic factors. Bubble plot and heatmap showing the functions and Gene Ontology (GO) terms of the listed proteins. c Experimental schematic of assay for transposase-accessible chromatin with high-throughput sequencing (ATAC-seq) and GATA3 chromatin immunoprecipitation sequencing (ChIP-seq). Differentially accessible regions (DAR) between recombinant (rIL-33)- and phosphate-buffered saline (PBS)-treated ILC2s were classified into GATA3-bound (blue) and nonbound (orange) regions (middle). Enriched sequence motifs for the GATA3-bound DARs (right). d Representative tracks at an arbitrary locus (near Il13) illustrating signals in ATAC-seq (first and second tracks) and GATA3 ChIP-seq (third track) samples of liver ILC2s. e JunB binding to the upstream regions of the Il13 gene was assessed by ChIP with quantitative PCR (qPCR) (right) (n = 3 per group). The results show JunB binding motif1 (first and second column), motif2 (third), and nonbinding control regions far upstream of the Il13 gene (fourth and fifth). f The ILC2 cell line ILC2/b6 was infected with a retrovirus encoding FLAG-GATA3 and a retrovirus encoding JunB. Five days later, the extracts were subjected to immunoprecipition (IP) with an anti-FLAG (GATA3) antibody and then subjected to immunoblotting (IB) with an anti-JunB antibody (upper panel). The total cell lysates (input) were also subjected to IB in parallel (lower panel). These are representative figures of two independent experiments. g Mascot score and expression levels from single-cell RNA sequencing (scRNA-seq) data in liver ILC2s. h Experimental schema. Twenty-four hours after small interfering RNA (siRNA) transfection, liver ILC2s were subjected to real-time quantitative PCR (RT–qPCR) and RNA-seq analyses. i RT–qPCR of liver ILC2s transfected with various siRNAs. The expression of Il13 is shown (normalized to L32) (Ct si: n = 4, Gata3 si: n = 4, Junb si: n = 5, Pa2g4 si: n = 4, Irf8 si: n = 4, Calr si: n = 4, Jund si: n = 4, Runx1 si: n = 4, Runx3 si: n = 4). j Heatmap showing differentially expressed genes (DEG) in liver ILC2s transfected with Ct si, Gata3 si, Junb si, or Runx1 si. Unpaired one-sided Student’s t-test. *P < 0.05; **P < 0.01; ***P < 0.001. Each bar and its error bars represent the mean ± SD.

