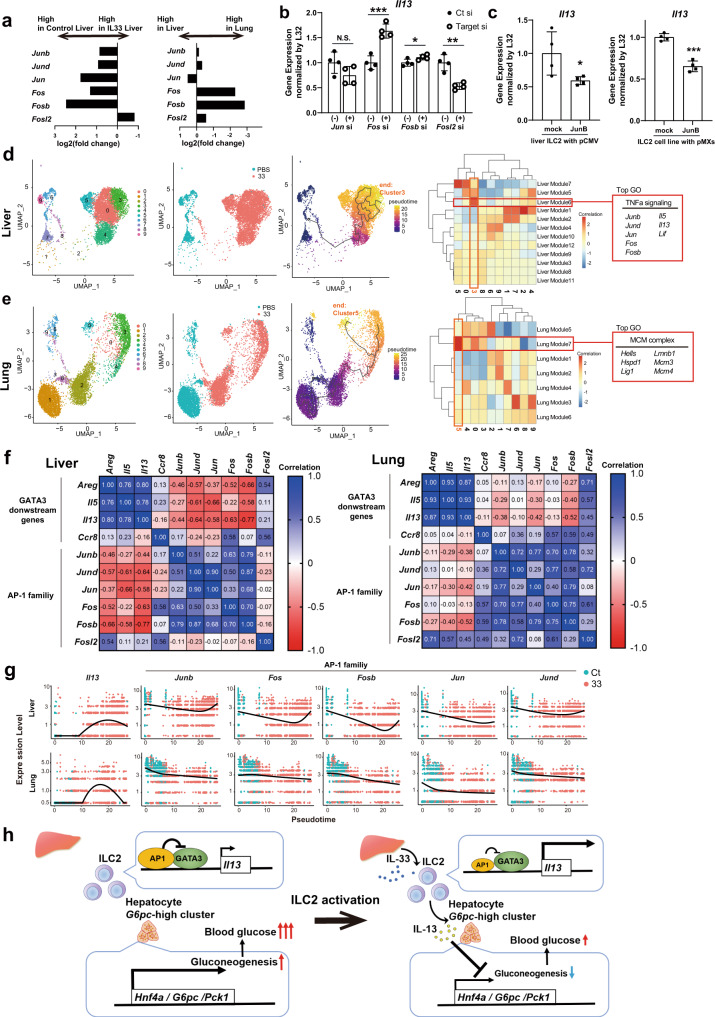
Fig. 8. Trajectory analysis reveals that AP-1 family member expression negatively correlates with Il13 expression, especially in liver group 2 innate lymphoid cells (ILC2s).
a–g Analysis based on single-cell RNA sequencing (scRNA-seq) data for liver ILC2s and lung ILC2s from phosphate-buffered saline-treated or recombinant IL-33 (rIL-33)-treated wild-type BALB/c mice. a Fold-change in the gene expression of AP-1 family members between control liver ILC2s and rIL-33-treated liver ILC2s (left) and between liver ILC2s and lung ILC2s (right). b Real-time quantitative PCR (RT‒qPCR) analysis of Il13 24 h after siRNA transfection of AP-1 family members (Jun, Fos, Fosb, Fosl2) in liver ILC2s (normalized to L32) (n = 3 per group). c RT‒qPCR analysis of Il13 24 h after transfection with a pCMV vector encoding JunB into liver ILC2s (left) and 5 days after infection with a retrovirus encoding JunB in the ILC2 cell line ILC2/b6 (right) (n = 3 per group). d, e Trajectory analysis of liver ILC2s and lung ILC2s using Monocle3. The root is defined as control ILC2s. d Module analysis showed that AP-1 family members and some genes downstream of GATA3 (Il13 and Il5) were coregulated and strongly associated with the end cluster (cluster 3). e Trajectory analysis of lung ILC2s showed a different end cluster compared with liver ILC2s, which was not associated with AP-1 family members and GATA3 downstream genes (cluster 5). f Correlation matrix for AP-1 family members and Gata3 downstream genes based on the average gene expression of each cluster in liver ILC2s (left) and lung ILC2s (right). g Pseudotime plot showing the expression levels of Il13 and AP-1 family members along the pseudotime axis. h Graphical abstract for this study. IL-33 induces IL-13 expression in liver ILC2s. IL-13 directly suppresses gluconeogenesis in hepatocytes by inhibiting gluconeogenic enzymes, such as G6pc and Pck1, leading to reduced blood glucose levels. AP-1 family members bind to GATA3 and suppress IL-13 production in liver ILC2s. Unpaired one-sided Student’s t-test. *P < 0.05; **P < 0.01; ***P < 0.001. Each bar and its error bars represent the mean ± SD.

