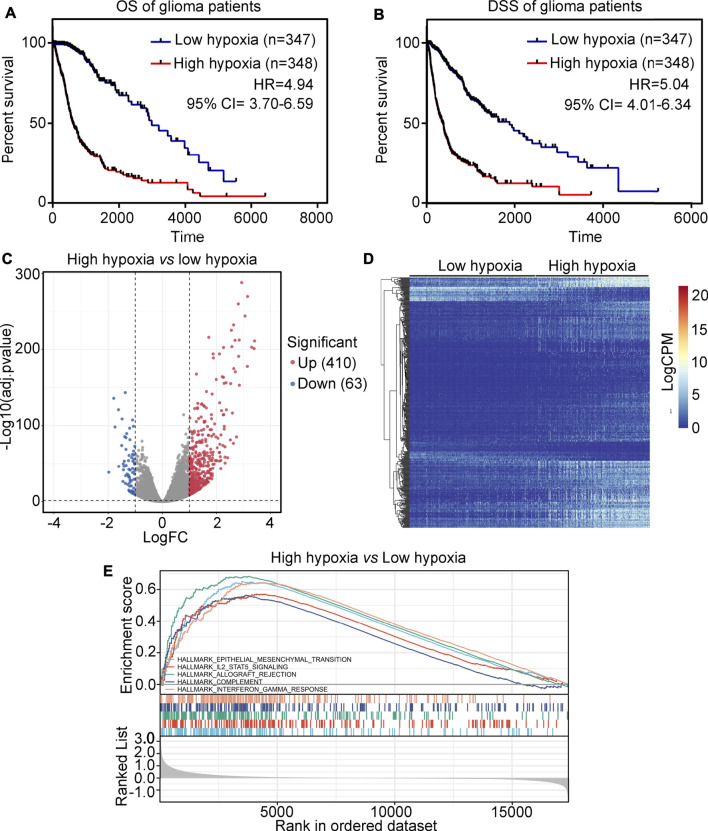
FIGURE 1.
Analysis of the landscape between high-hypoxia and low-hypoxia glioma tissues. (A) The overall survival (OS) rate between high-hypoxia and low-hypoxia groups of glioma patients. (B) The disease-specific survival (DSS) rate between high-hypoxia and low-hypoxia groups of glioma patients. (C) Volcano plot indicating DEGs between high-hypoxia and low-hypoxia groups of glioma tissues. (D) Heatmap indicating DEGs between high-hypoxia and low-hypoxia group of glioma tissues. (E) GSEA analysis of terms enriched in DEGs between the high-hypoxia and low-hypoxia groups of glioma tissues.

