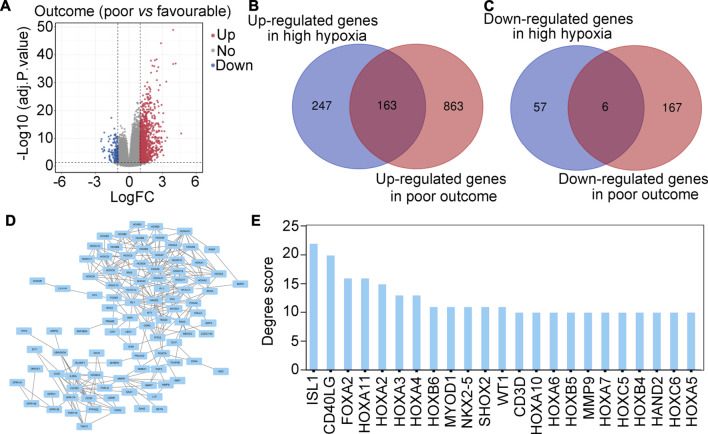
FIGURE 2.
Screening important hypoxia-driven genes associated with poor outcome in glioma tis-sues. (A) Volcano plot indicating DEGs between glioma patients with poor (progressive disease, PD) or favorable (complete response, CR + partial response, PR + stable disease, SD) outcomes. (B) Intersection analysis demonstrated that 163 genes were up-regulated in gliomas with high-hypoxia and poor outcome. (C) Intersection analysis demonstrated that 6 genes were down-regulated in gliomas with high hypoxia and poor outcome. (D) PPI network of 169 important hypoxia driven genes associated with outcome in glioma. (E) Degree score of genes in the PPI network ≥10.

