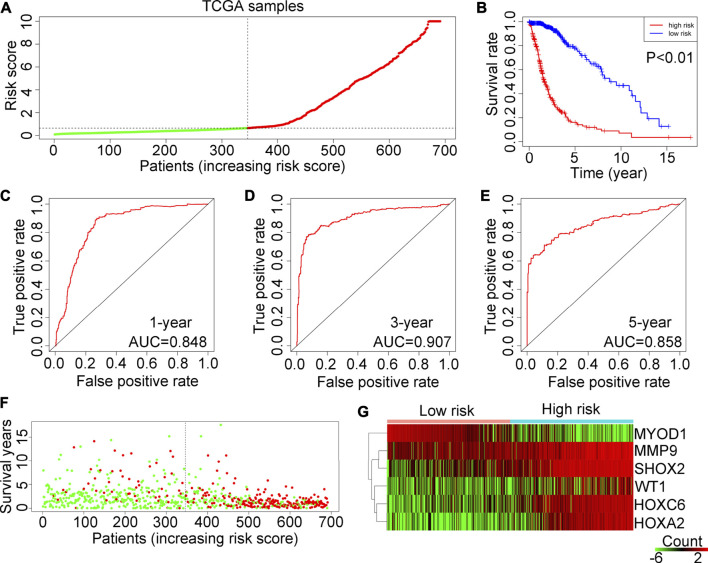
FIGURE 4.
Examination of the risk model in the TCGA training cohort. (A) Glioma samples in the TCGA were divided into low-risk and high-risk groups. (B) Kaplan–Meier plot analysis of the overall survival rates of low-risk or high-risk patients with glioma in the TCGA. (C–E) Receiver operating characteristic (ROC) curves showing the diagnostic value of the risk model for the 1-year, 3-year and 5-year survival rates of patients with gliomas in the TCGA. (F) Survival time and status of each glioma patient in the TCGA cohort. (G) Expression levels of MYOD1, MMP9, SHOX2, WT1, HOXC6 and HOXA2 in glioma tissues from patients with high-risk or low-risk scores in the TCGA.

