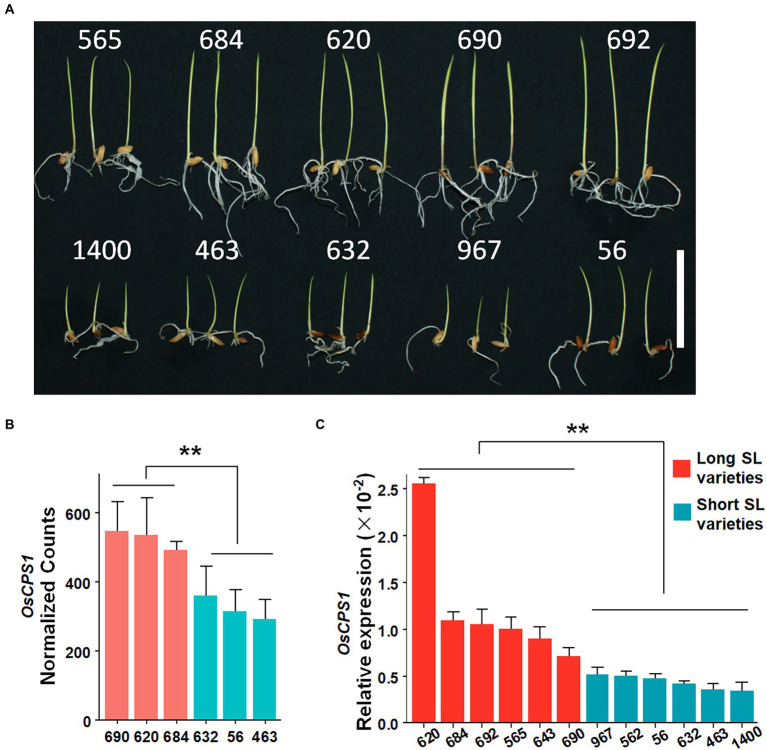
Figure 3.
The SL phenotype and the candidate gene OsCPS1 expression in different varieties. (A) The phenotype of representative varieties after 5 days germination. Scale bar 50 mm. (B) OsCPS1 expression analysis by RNA-seq. Red bars represent long SL varieties, blue bars represent short SL varieties. Data are shown as means ± SD (n = 3). **p < 0.01. t-test. (C) OsCPS1 expression analysis by qRT-PCR. Red bars represent long SL varieties, blue bars represent short SL varieties. Data are shown as means ± SD. **p < 0.01. t-test.

