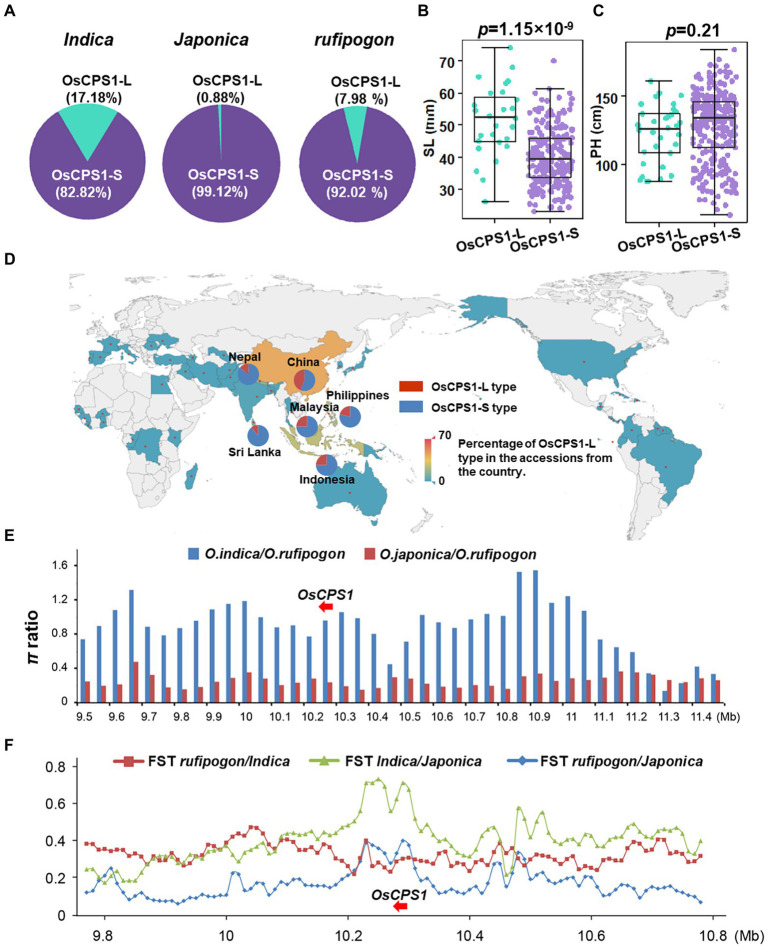
Figure 6.
Haplotype analysis and domestication analysis of OsCPS1. (A) The percentage of 36-bp deletion in indica, japonica and rufipogon. (B) Shoot length of OsCPS1-L type accessions and OsCPS1-S type accessions. (C) Plant height of OsCPS1-L type accessions and OsCPS1-S type accessions. (D) Geographical distribution analysis of OsCPS1-L type accessions and OsCPS1-S type accessions in the world. (E) π (nucleotide diversity) ratio in genome region surrounding OsCPS1. Blue bar means π ratio between indica and rufipogon, red bar means π ratio between japonica and rufipogon. (F) FST (fixation index) in the region surrounding OsCPS1 among rufipogen, indica and japonica.

