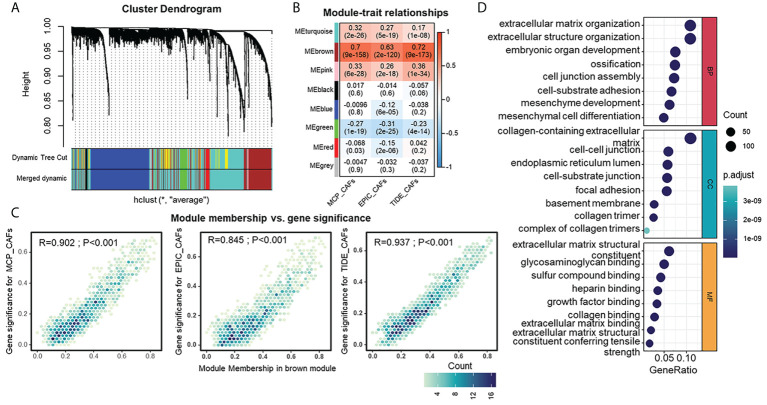
Figure 3.
Detection and functional interpretations of a gene co-expression module shared CAFs characteristics in HGSOC. (A) Network analysis of gene expression in HGSOC cohort. Dendrograms obtained by average linkage hierarchical clustering of genes on the basis of topological overlap. Modules of co-expressed genes were assigned colors. The color row underneath the dendrogram shows the modules assigned by the Dynamic Tree Cut and merged to produce eight distinct modules. (B) Module-trait relationships: Each column corresponds to a trait, and each row corresponds to a module eigengene. The number in the rectangle indicates the correlation coefficients (P-values in the brackets). The table is color-coded by correlation based on the color legend: red to blue indicates a positive to negative correlation of module eigengenes with traits. (C) Scatter plot of module eigengenes in brown module. (D) Gene Ontology analysis of genes in the brown module. CC, cellular component (upper); MF, molecular function (middle); BP, biological process (bottom).

