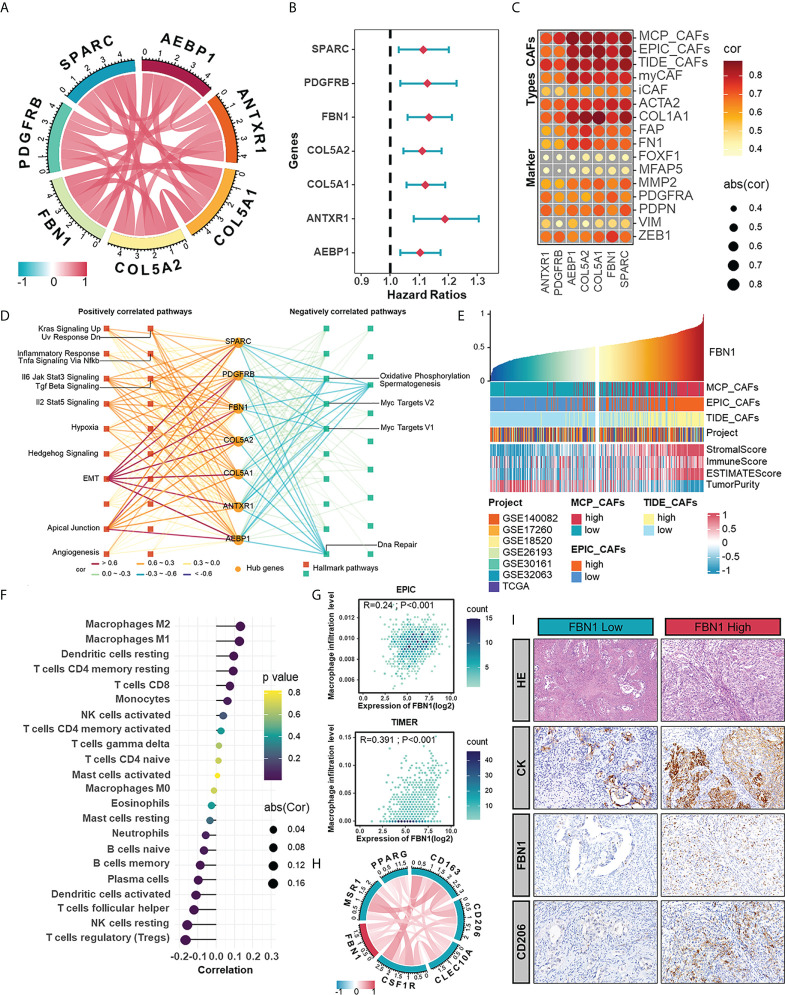
Figure 4.
The hub genes extracted from CAFs-related module as potential CAF markers participating in the shaping of tumor microenvironment. (A) The correlations between any two hub genes. (B) Forest plot of univariate Cox analysis of hub genes in meta-cohort. (C) The correlations between hub genes and CAF signatures (MCP, EPIC, and TIDE) and CAF markers. (D) Hallmark pathways in which hub genes were involved. (E) The TME scores in HGSOC samples ranked by the mRNA level of FBN1. (F) The correlation between the mRNA expression of FBN1 and the level of immune cell infiltration calculated by CIBERSORT. (G) The positive correlations between the mRNA expression of FBN1 and the level of macrophage infiltration calculated by EPIC and TIMER. (H) The correlations between the expression of FBN1 and M2 macrophage markers in mRNA levels. (I) HE staining and IHC staining of CK, FBN1 and CD206 in one sample with relatively low protein expression of FBN1 and the other with high protein expression of FBN1.

