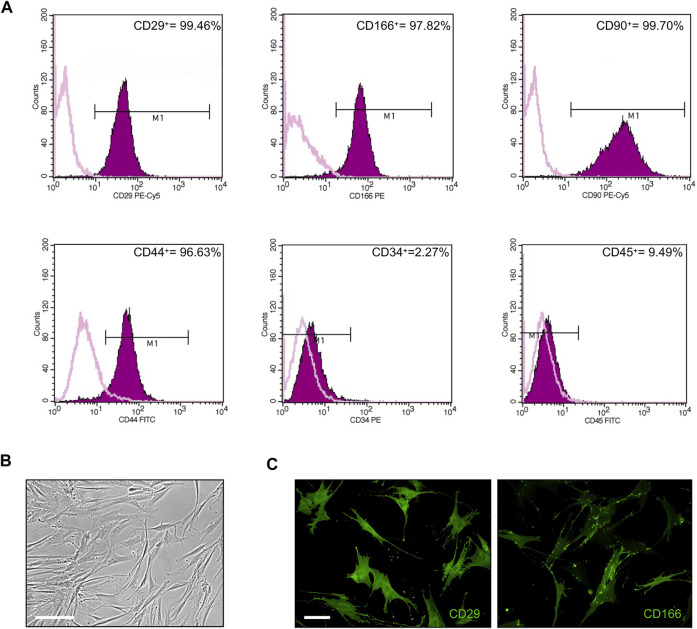
FIGURE 1.
Phenotypical characterization of ASCs. (A) Flow cytometric analysis of ASC cells stained with monoclonal antibodies directed against the mesenchymal markers CD29, CD166, CD90, and CD44, or the hematopoietic markers CD34 and CD45. Purple areas represent patterns obtained with antibodies against the indicated markers, whereas pink lines represent the isotype-matched monoclonal antibody that served as a control. (B) Phase-contrast photomicrograph showing the fibroblast-like morphology of ASCs. Scale bar: 200 μm. (C) Representative images of CD29 and CD166 expression in ASCs by IF analysis. Scale bar: 50 μm.

