FIGURE 4.
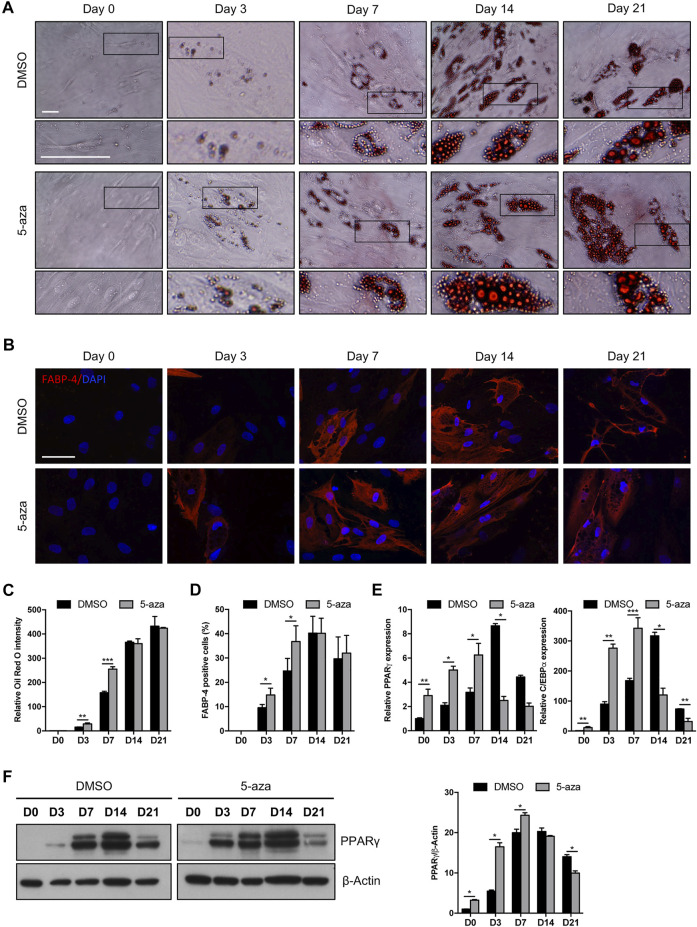
5-aza affects ASC adipogenic differentiation. (A) Phase-contrast photomicrographs showing ASCs pretreated with 5-aza or DMSO and stained with Oil Red O to visualize lipid accumulation at day 0, 3, 7, 14 and 21 of adipogenic induction (D0-D21). Representative areas of the full image are presented as enlargements in lower panels. Scale bars: 50 µm. (B) IF analysis showing the expression of FABP4 (red). Nuclei were visualized using DAPI (blue). Scale bar: 50 µm. (C) Quantitative analysis of lipid droplets by measuring Oil Red O absorbance. (D) Percentage of FABP4-positive cells, determined by counting the number of FABP4-positive cells vs. total number of cells in ten random areas for each condition. (E) PPARγ and c/EBPα mRNA expression, evaluated by qRT-PCR. mRNA levels were normalized to GAPDH mRNA expression. (F) Western blot analysis of PPARγ protein expression. β-Actin was used as internal control. Densitometric analysis was reported as relative expression with respect to D0 of DMSO-treated cells. Bars represent means ± SD of three independent experiments, each performed in triplicate. *p < 0.05, **p < 0.005, ***p < 0.0005 vs. DMSO.

