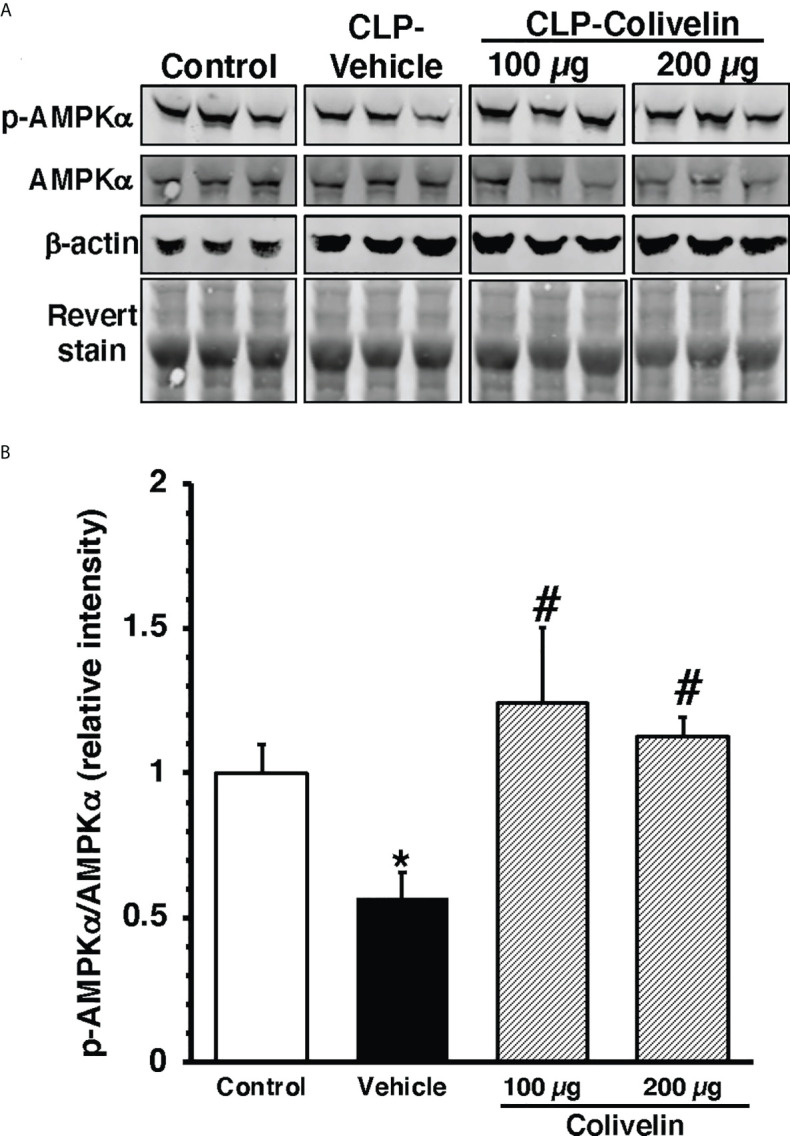
Figure 9.

Representative Western blots of total AMPKα and pAMPKα in cytosol extracts of thoracic aorta; β-actin and Revert stain were used to verify loading of proteins (A). Image analyses of ratio of relative intensity of p-AMPKα/AMPKα (B) as determined by densitometry. Vehicle (200 µl distilled water) or colivelin (100 µg/kg) was administered intraperitoneally at 1 h after CLP. Each data represents the mean ± SEM of 3-4 mice for group (n=3 control group, n=4 vehicle group, n=4 colivelin 100 µg group). *Represents P < 0.05 versus control mice; #represents P < 0.05 versus vehicle-treated mice.
