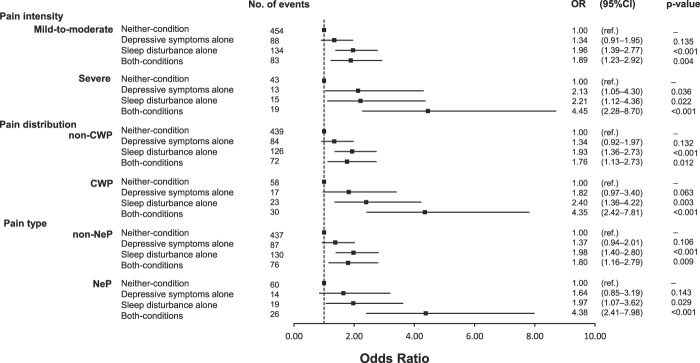
Figure 2.
Forest plot depicting multivariable-adjusted ORs and 95% CIs by chronic pain subgroups (pain intensity, pain distribution, and pain type) according to the status of depressive symptoms and sleep disturbance. ORs and 95% CIs were computed by a multinomial logistic regression analysis. The multivariable model was adjusted for age, sex, education level, employment status, subjective economic status, comorbidities, current smoking, current drinking, regular exercise, living alone, number of communications with someone per month, and experiences of bereavement. CI, confidence interval; CWP, chronic widespread pain; NeP, neuropathic-like pain; OR, odds ratio.

