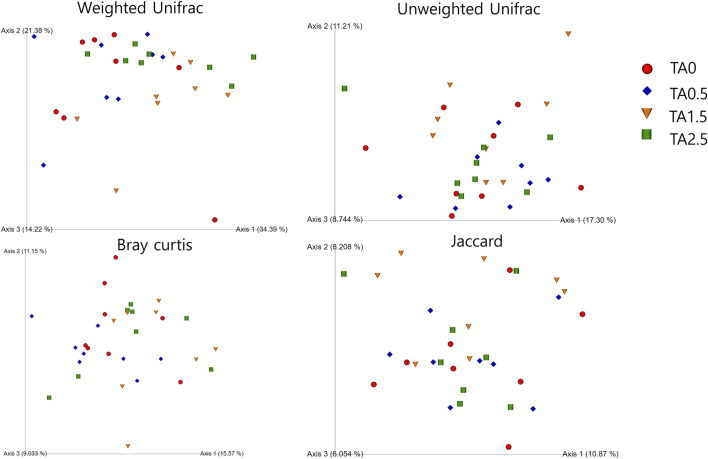
FIGURE 12.
Visualization of beta diversity indices (weighted and unweighted Unifrac, bray curtis, and jaccard) in the broilers of the tannic acid 0 (TA0): basal diet without tannic acid; 2) tannic acid 0.5 (TA0.5): basal diet with 0.5 g/kg tannic acid; 3) tannic acid 1.5 (TA1.5); and 4) tannic acid 2.5 (TA2.5) groups on D 21. The treatment groups were compared using one-way ANOVA followed by the Tukey’s multiple comparison. Different superscripts differ at p < 0.05.

