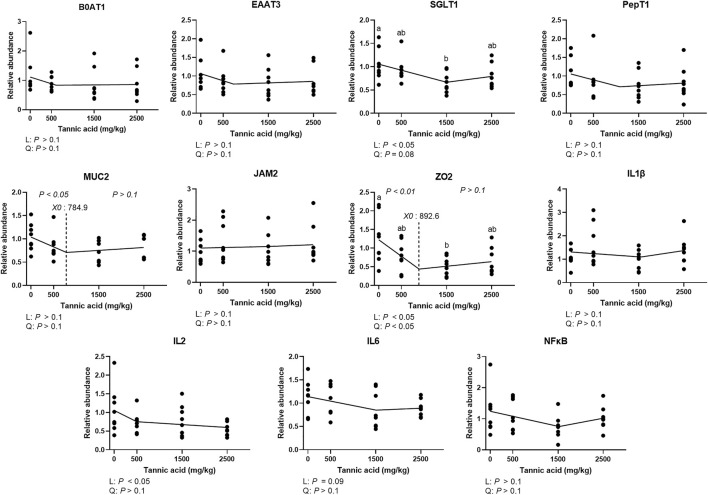
FIGURE 5.
Relative mRNA expression of genes associated with nutrient transportation, gut barrier integrity, and inflammation in the jejunum in broiler chickens fed different concentrations (0, 0.5, 1.5, and 2.5 g/kg) of tannic acid on D 21. The treatment groups were compared using one-way ANOVA followed by the Tukey’s multiple comparison. Different superscripts differ at p < 0.05. Orthogonal polynomial contrasts analysis was conducted to see linear pattern (L) and quadratic pattern (Q) among the treatments. To calculate the optimal dosage of tannic acid in broilers, segmented linear regression was conducted, and X0 (inflection point) with p values for slope 1 (lower than X0) and slope 2 (higher than X0) were presented. B0AT1, sodium-dependent neutral amino acid transporter 1; EAAT3, excitatory amino acid transporter 3; SGLT1, sodium glucose transporter 1; PepT1, peptide transporter 1; MUC2, mucin 2; JAM2, Junctional adhesion molecule 2; Zonula occludens 2; zonula occludens 2; IL, interleukin; NFκB, nuclear factor kappa-light-chain-enhancer of activated B cells.

