FIGURE 6.
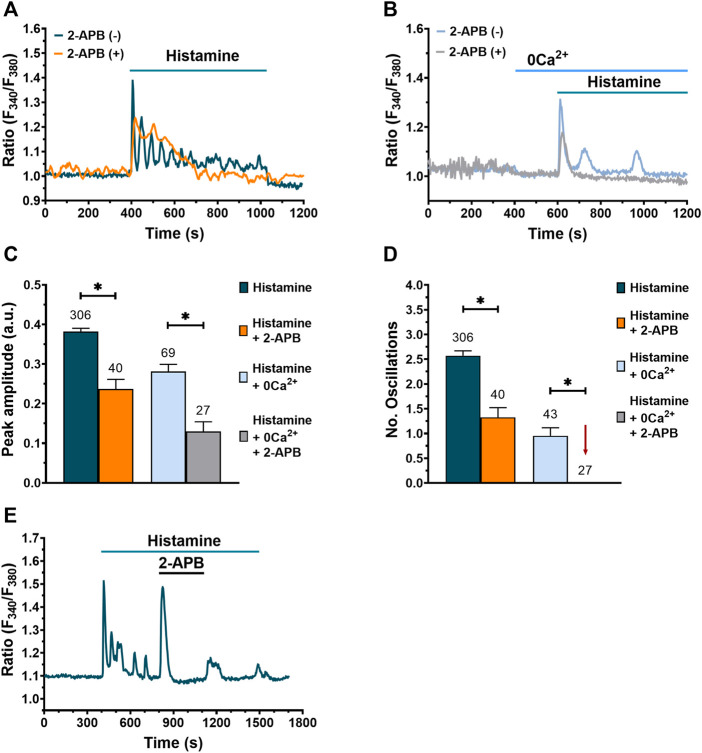
Involvement of InsP3R in histamine-evoked Ca2+ signals in WI-38 human lung fibroblasts. (A) Typical recording of the Ca2+ response to histamine (300 µM) in fibroblasts pre-incubated with 2-APB (50 μM) for 20 min [orange trace, 2-APB (+)] and its control [dark green trace, 2-APB (-)]. (B) Typical recording of histamine-evoked Ca2+ signal in absence of extracellular Ca2+ (0Ca2+) after pre-incubation of fibroblasts for 20 min with 2-APB (50 μM) [gray trace, 2-APB (+)] and its control [blue trace, 2-APB (-)]. In (A,B) basal Ca2+ levels were aligned for comparative purposes. (C) Mean ± SE of the peak amplitude of the Ca2+ response to histamine (300 µM) in normal extracellular Ca2+ and in absence (dark green bar) or presence of 50 μM 2-APB (orange bar). Mean ± SE of the peak amplitude of the Ca2+ response to histamine (300 µM) in absence of extracellular Ca2+ (0Ca2+) and in absence (blue bar) or presence of 50 μM 2-APB (gray bar). Statistic comparison between groups was performed using Mann-Whitney and t-Student test respectively (* = p ≤ 0.05). (D) Mean ± SE of the number of oscillations evoked by histamine (300 µM) in normal extracellular Ca2+ and in absence (dark green bar) or presence of 50 μM 2-APB (orange bar). Mean ± SE of the number of oscillations evoked by histamine (300 µM) in the absence of extracellular Ca2+ (0Ca2+) and in absence (blue bar) or presence of 50 μM 2-APB (gray bar, gray bar not visible, marked with a red arrow). Statistical comparison between groups was performed using Mann-Whitney and t-Student test respectively (* = p ≤ 0.05). The numbers in the figure represents the number of cells studied. (E) Typical recording of the Ca2+ signal evoked by histamine and the effect of 2-APB application.

