. 2022 Jul 14;82(18):3275–3290. doi: 10.1158/0008-5472.CAN-22-0363

Figure 1.

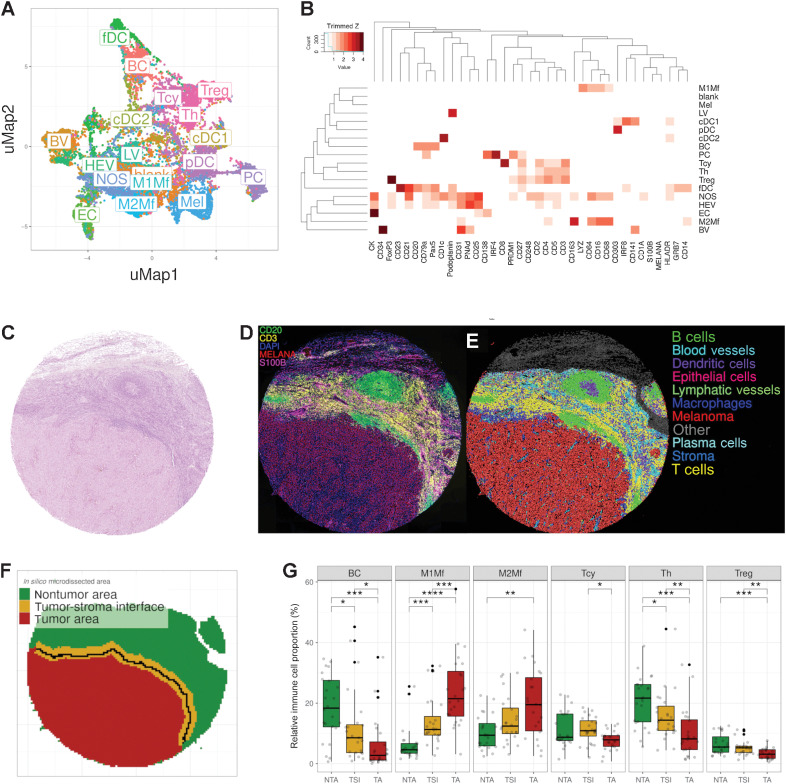
Figure 1. Phenotypic identification and in silico microdissection. A, uMAP showing the 18 different cell phenotypes identified during phenotypic clustering. The colors in the uMAP represent the populations after manual annotation of the 67 clusters obtained with the preselected 37 protein markers. B, Heatmap showing the protein signatures of the different cell phenotypes: rows represent identified cell types, columns represent protein markers. The score inside each cell of the matrix indicates the average expression of the marker in the identified population. Representative core from sample MEL9 from patient PT7 with hematoxylin and eosin. C, Composite fluorescent image of four markers (+DAPI) after image processing (D), digital reconstruction of the core highlighting the phenotypic identify of each individual cell (E), and in silico microdissection into three areas and the tumor edge (solid black line) within the TSI (F). G, Cell composition analysis of selected cell phenotypes comparing the relative proportion of immune cells in the different in silico microdissected areas (NTA: nontumor area, TSI: tumor-stroma interface, TA: tumor area), using pairwise Wilcoxon test. BC: B cells; PC: plasma cells; cDC1: classical dendritic cells type I; cDC2: classical dendritic cells type II; fDC: follicular dendritic cells; pDC: plasmacytoid dendritic cells; Tcy: cytotoxic T cells; Th: T helper cells; Treg: regulatory T cells; BV: blood vessels; HEV: high endothelial venules; LV: lymphatic vessels; M1Mf: M1-like macrophages; M2Mf: M2-like macrophages; Mel: melanoma cells; NOS: not otherwise specified. *, P < 0.05; **, P < 0.01; ***, P < 0.001; ****, P < 0.0001. P values > 0.05 are not reported.

Phenotypic identification and in silico microdissection. A, UMAP showing the 18 different cell phenotypes identified during phenotypic clustering. The colors in the UMAP represent the populations after manual annotation of the 67 clusters obtained with the preselected 37 protein markers. B, Heatmap showing the protein signatures of the different cell phenotypes. Rows represent identified cell types; columns represent protein markers. The score inside each cell of the matrix indicates the average expression of the marker in the identified population. C, Representative core from sample MEL9 from patient PT7 with hematoxylin and eosin staining. D–F, Composite fluorescent image of four markers (+DAPI) after image processing (D), digital reconstruction of the core highlighting the phenotypic identify of each individual cell (E), and in silico microdissection into three areas and the tumor edge (solid black line) within the TSI (F). G, Cell composition analysis of selected cell phenotypes comparing the relative proportion of immune cells in the different in silico microdissected areas (NTA, nontumor area; TSI, tumor-stroma interface; TA, tumor area), using pairwise Wilcoxon test. BC, B cells; PC, plasma cells; cDC1, classical dendritic cells type I; cDC2, classical dendritic cells type II; fDC, follicular dendritic cells; pDC, plasmacytoid dendritic cells; Th, T helper cells; BV, blood vessels; HEV, high endothelial venules; LV, lymphatic vessels; M1Mf, M1-like macrophages; M2Mf, M2-like macrophages; Mel, melanoma cells; NOS, not otherwise specified. *, P < 0.05; **, P < 0.01; ***, P < 0.001; ****, P < 0.0001. P values > 0.05 are not reported.