. 2022 Jul 14;82(18):3275–3290. doi: 10.1158/0008-5472.CAN-22-0363

Figure 2.

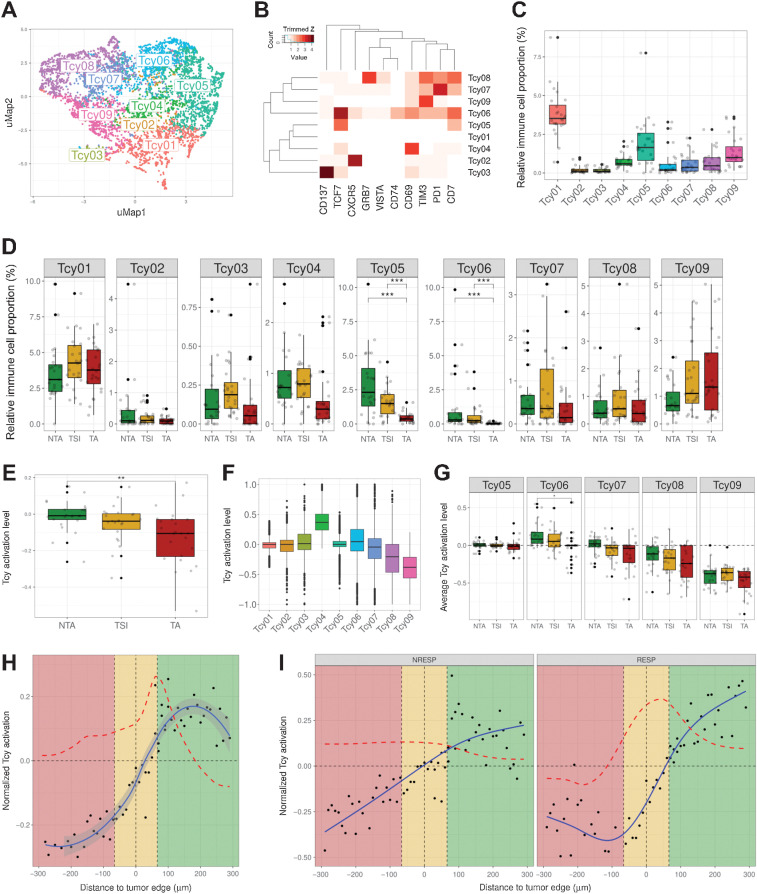
Figure 2. Profiling of Tcys: cytometry and activation. A, uMAP showing the nine different Tcy subtypes identified during Tcy clustering. The colors represent the populations after manual annotation of the 34 clusters identified by KMeans with the selected 10 markers. B, Heatmap showing the protein signatures of the different Tcy subtypes: rows represent identified Tcy subtypes, columns represent protein markers. The score inside each cell of the matrix represents the average expression of the marker in the subtype. C, Relative immune cell proportion of different Tcy subtypes. D, Cell composition analysis of Tcy subtypes comparing the relative proportion within Tcy in the different in silico microdissected areas (NTA: nontumor area, TSI: tumor-stroma interface, TA: tumor area), using pairwise Wilcoxon test. E, Average activation of Tcy in the different in-silico microdissected areas (NTA: nontumor area, TSI: tumor-stroma interface, TA: tumor area), using pairwise t test. F, Boxplots representing the activation of different selected Tcy subtypes. G, Boxplots representing the activation of the different subtypes within the different in silico microdissected areas using pairwise t test. H, Activation gradients around the tumor edge (all patients). Greenshaded area represents the NTA, gold-shaded area represents the tumor-stroma interface, red-shaded area represents the tumor area. Each black dot represents the average activation level of the Tcy at a given discretized distance from the tumor edge. The blue line represents the curve fitting for the population of black dots. The red dashed line represents the first-order derivative of the blue line. I, Activation gradients around the tumor edge (RESP: responders vs. NRESP: nonresponders). *, P < 0.05; **, P < 0.01; ***, P < 0.001. P values > 0.05 are not reported.

Profiling of Tcys: cytometry and activation. A, UMAP showing the nine different Tcy subtypes identified during Tcy clustering. The colors represent the populations after manual annotation of the 34 clusters identified by KMeans with the selected 10 markers. B, Heatmap showing the protein signatures of the different Tcy subtypes. Rows represent identified Tcy subtypes; columns represent protein markers. The score inside each cell of the matrix represents the average expression of the marker in the subtype. C, Relative immune cell proportion of different Tcy subtypes. D, Cell composition analysis of Tcy subtypes comparing the relative proportion within Tcy in the different in silico microdissected areas (NTA, nontumor area; TSI, tumor-stroma interface; TA, tumor area), using pairwise Wilcoxon test. E, Average activation of Tcy in the different in-silico microdissected areas, using pairwise t test. F, Boxplots representing the activation of different selected Tcy subtypes. G, Boxplots representing the activation of the different subtypes within the different in silico microdissected areas using pairwise t test. H, Activation gradients around the tumor edge (all patients). Green-shaded area, NTA; gold-shaded area, tumor-stroma interface; red-shaded area, tumor area. Each black dot represents the average activation level of the Tcy at a given discretized distance from the tumor edge. The blue line represents the curve fitting for the population of black dots. The red dashed line represents the first-order derivative of the blue line. I, Activation gradients around the tumor edge (RESP, responders vs. NRESP, nonresponders). **, P < 0.01; ***, P < 0.001. P values > 0.05 are not reported.