. 2022 Jul 14;82(18):3275–3290. doi: 10.1158/0008-5472.CAN-22-0363

Figure 4.

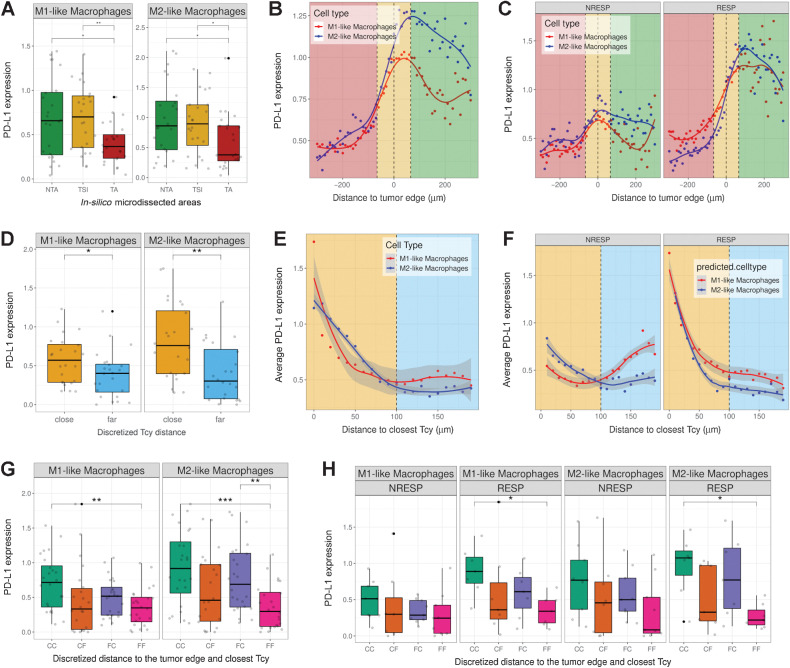
Figure 4. PD-L1 expression in macrophages. A, Boxplots showing PD-L1 expression in M1-like and M2-like macrophages in the different in silico microdissected areas. (NTA: nontumor area, TSI: tumor-stroma interface, TA: tumor area), using pairwise t test test. B, PD-L1 gradient based on distance to the tumor edge. Green-shaded area represents the NTA, gold-shaded area represents the TSI, red-shaded area represents the tumor area. Dots represent the average PD-L1 expression in M1-like and M2-like macrophages at a certain distance of the tumor edge. Lines represent the fitted curves for those clouds of points. C, PD-L1 gradient based on distance to the tumor edge stratified by patient response. D, Boxplots showing PD-L1 expression based on discretized distance to closest Tcy (cut-off distance value: 100 μm) using pairwise t test (FDR corrected). E, Scatter plot showing PD-L1 expression in M1-like and M2-like macrophages based on their distance to the closest Tcy. Each dot represents the average expression of the macrophages located at a certain distance from the closest Tcy (bins of 10 μm). Yellow-shaded area represents the “close” region, light-blue-shaded area represents the “far” region. F, Scatter plot showing the PD-L1 expression in M1-like and M2-like macrophages based on their distance to closest Tcy stratified by patient response (RESP: responders, NRESP: nonresponders). G, Boxplots showing PD-L1 expression based on discretized distance to the edge and to closest Tcy using pairwise t test (FDR corrected) (CC: Close-Close, CF: Close-Far, FC: Far-Close, FF: Far-Far). H, Boxplots showing PD-L1 expression based on discretized distance to the edge and to closest Tcy stratified by patient response using pairwise t test (FDR corrected). *, P < 0.05; **, P < 0.01. P values > 0.05 are not reported.

PD-L1 expression in macrophages. A, Boxplots showing PD-L1 expression in M1-like and M2-like macrophages in the different in silico microdissected areas (NTA, nontumor area; TSI, tumor-stroma interface; TA, tumor area), using pairwise t test test. B, PD-L1 gradient based on distance to the tumor edge. Green-shaded area, NTA; gold-shaded area, TSI; red-shaded area, tumor area. Dots represent the average PD-L1 expression in M1-like and M2-like macrophages at a certain distance of the tumor edge. Lines represent the fitted curves for those clouds of points. C, PD-L1 gradient based on distance to the tumor edge stratified by patient response. D, Boxplots showing PD-L1 expression based on discretized distance to closest Tcy (cut-off distance value, 100 μm) using pairwise t test (FDR corrected). E, Scatter plot showing PD-L1 expression in M1-like and M2-like macrophages based on their distance to the closest Tcy. Each dot represents the average expression of the macrophages located at a certain distance from the closest Tcy (bins of 10 μm). Yellow-shaded area, “close” region; light-blue-shaded area, “far” region. F, Scatter plot showing the PD-L1 expression in M1-like and M2-like macrophages based on their distance to closest Tcy stratified by patient response (RESP, responders; NRESP, nonresponders). G, Boxplots showing PD-L1 expression based on discretized distance to the edge and to closest Tcy using pairwise t test (FDR corrected). CC, Close-Close; CF, Close-Far; FC, Far-Close; FF, Far-Far. H, Boxplots showing PD-L1 expression based on discretized distance to the edge and to closest Tcy stratified by patient response using pairwise t test (FDR corrected). *, P < 0.05; **, P < 0.01; ***, P < 0.001. P values > 0.05 are not reported.