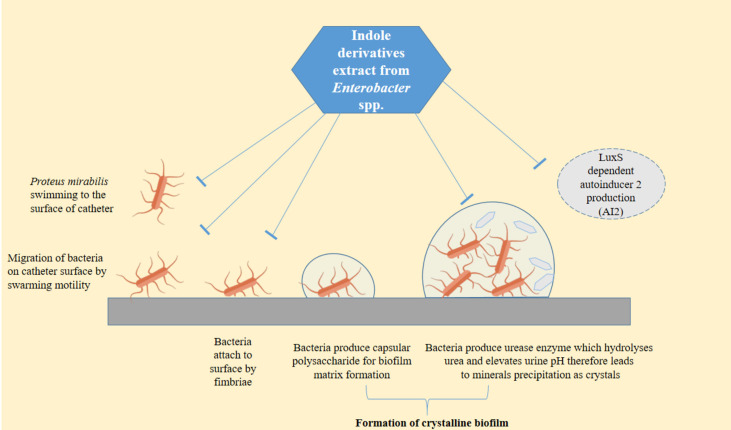
Figure 6.
Schematic diagram summarizing steps of biofilm formation by P. mirabilis on urinary catheter and the effects of the indole derivative extract from the supernatant of Enterobacter sp. at the phenotypic and molecular levels. In this figure, lines was designed with bar-headed end indicate repression of gene expression or repression of a phenotype. Used vector of flagellated bacteria designed by Freepik (Freepik.com).

