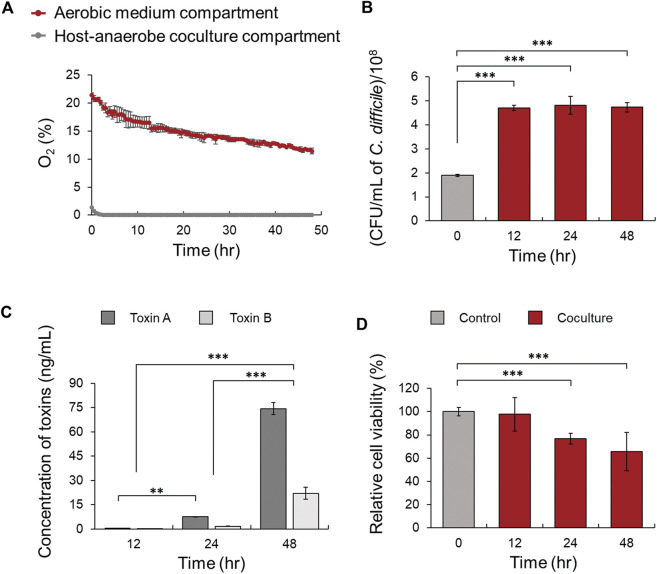
FIGURE 2.
(A) Comparison of oxygen concentration in the host-anaerobe coculture and aerobic medium compartments in the MIMICS. (B) Comparison of the viability of C. difficile cultured with Caco-2 cells in MIMICS for 0, 12, 24, and 48 h. (C) Production of toxins A and B at 12, 24, and 48 h. (D) Comparison of the viability of Caco-2 cells according to coculture with C. difficile at 0, 12, 24, and 48 h compared to the control. Control means monoculture of Caco-2 cells. The error bars represent the standard deviation of triplicate samples. *p < 0.05, **p < 0.01, ***p < 0.001.

