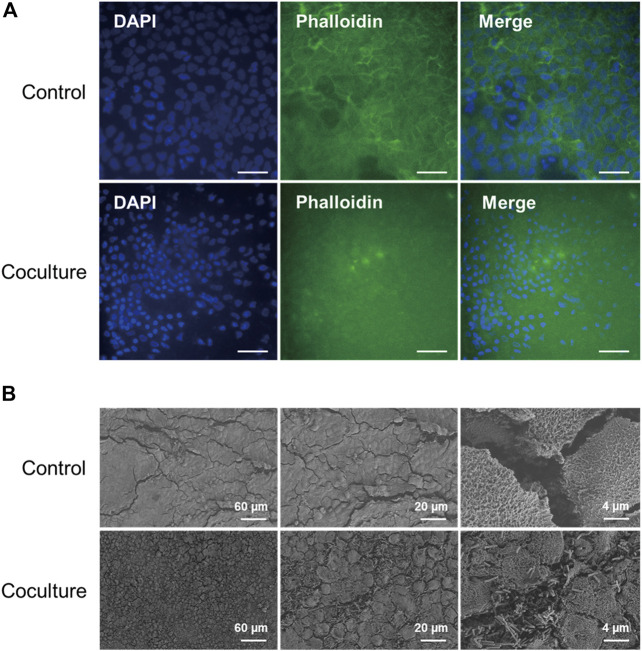
FIGURE 3.
(A) Immunofluorescence microscopy images of Caco-2 cells in accordance with coculture with C. difficile at 48 h. F-actin is stained with phalloidin (green), and cell nuclei are stained with DAPI (blue). Control means monoculture of Caco-2 cells. Scale bars represent 50 µm. (B) Scanning electron microscopy images of Caco-2 cells in accordance with coculture with C. difficile at 48 h. SEM images were acquired at sequentially increased magnifications as indicated by the scale bar of each image.

