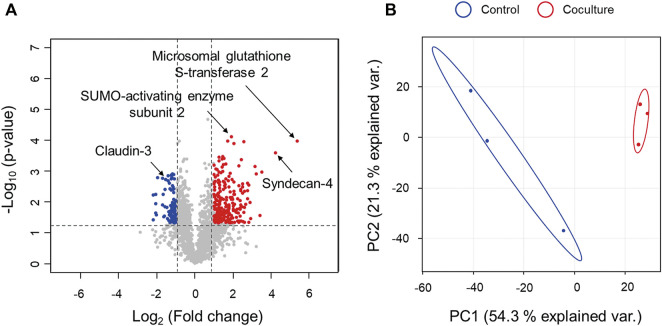
FIGURE 4.
Comparison of proteomics results for Caco-2 cells in coculture with C. difficile at 12 h versus monoculture. (A) Volcano plot for comparison of proteomic differences with respect to coculture with C. difficile at 12 h. Volcano plots indicate the upregulated proteins of Caco-2 cells during coculture with C. difficile in red circles and downregulated proteins in blue circles. Indications denote the proteins discussed in this study. (B) Principal component analysis (PCA) plot for comparison of proteomic differences according to coculture with C. difficile at 12 h. Control means monoculture of Caco-2 cells. Proteomic analysis was performed in triplicate.

