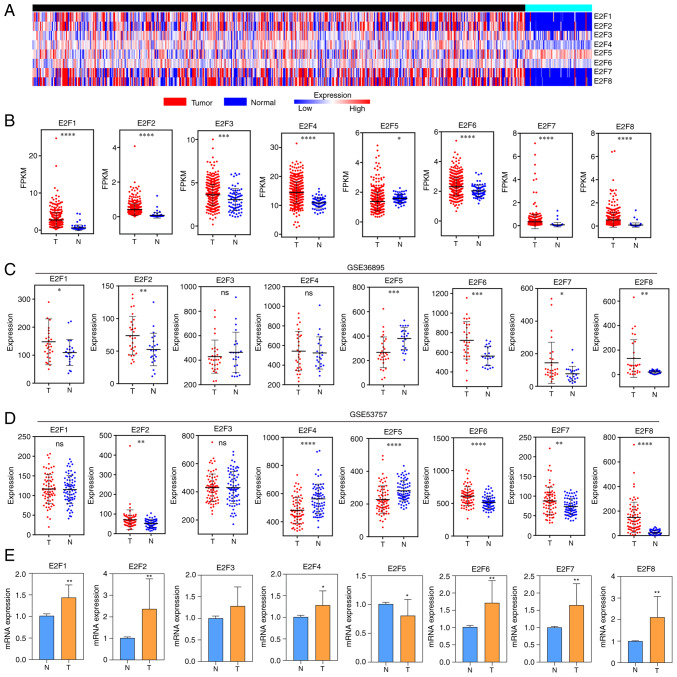
Figure 1.
Expression of the E2F family in ccRCC. (A) Heatmap displaying the expression of E2Fs in ccRCC using the total tumor (n=530) and normal (n=72) ccRCC data from TCGA. (B) Scatter plot displaying the expression of tumor tissues (n=530) and normal tissues (n=72) from TCGA. (C) Scatter plot displaying the expression of tumor tissues (n=72) and normal tissues (n=72) from dataset GSE36895. (D) Scatter plot displaying the expression of tumor tissues (n=29) and normal tissues (n=23) from dataset GSE53757. (E) Reverse transcription-quantitative PCR showing the expression of E2Fs in 10 paired ccRCC and normal samples. Data are presented as the mean ± SEM. *P<0.05, **P<0.01, ***P<0.001 and ****P<0.0001. ccRCC, clear cell renal cell carcinoma; TCGA, The Cancer Genome Atlas.

