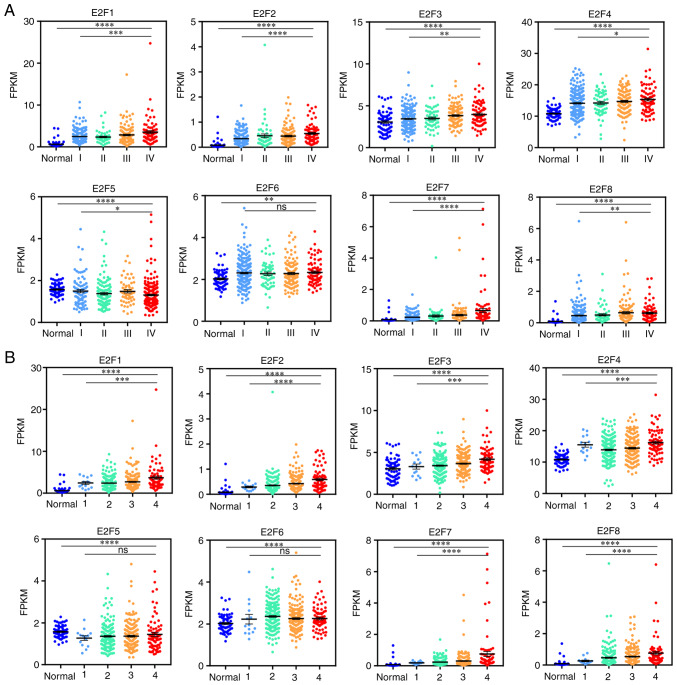
Figure 2.
Relationship between E2F expression and pathological status of ccRCC. (A) Scatter plot displaying the expression of E2Fs in normal tissues and stages I–IV of ccRCC. (B) Scatter plot displaying the expression of E2Fs in normal tissues and grade 1–4 ccRCC. *P<0.05, **P<0.01, ***P<0.001 and ****P<0.0001. ccRCC, clear cell renal cell carcinoma.

