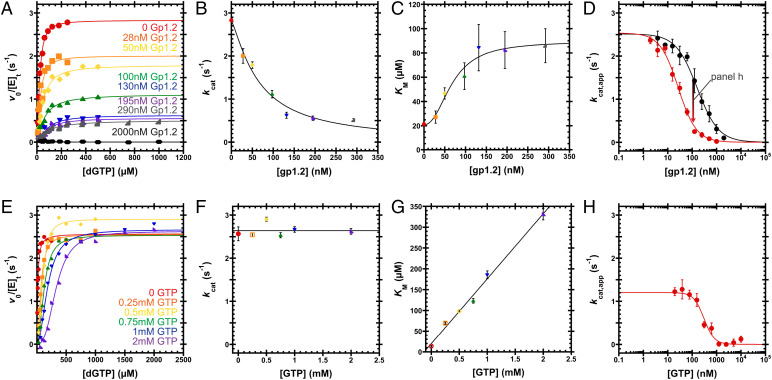
Fig. 6.
Inhibition of Dgt by Gp1.2 and GTP. (A) v0/[E]t versus [dGTP] curves varying Gp1.2 (see labels). A single experiment was performed for each condition. Eq. 1 is fit to the data. (B and C) Gp1.2 displays a mixed-type inhibition, wherein kcat decreases and KM increases with increasing Gp1.2. Data are the kcat or KM and SE from fitting Eq. 1 to the data in A. Eq. 2 is fit to the data in B to yield IC50 = 66 ± 8 nM and nH = 1.3 ± 0.2. Eq. 3 is fit to the data in C to yield IC50 = 70 ± 10 nM and nH = 2.3 ± 0.9. (D) Titrating Gp1.2 against Dgt under kcat,app conditions (black, 250 µM dGTP) or Dgt with 1 mM GTP (red, 2 mM dGTP). Data are the mean and SEM of three independent experiments. Eq. 4 is fit to the data. Gp1.2 inhibits Dgt to completion with IC50 = 160 ± 20 nM and nH = 1.0 ± 0.1. With 1 mM GTP, Gp1.2 inhibits with IC50 = 27 ± 3 nM and nH = 1.2 ± 0.1. (E) v0/[E]t versus [dGTP] curves at various GTP concentrations (see labels). A single experiment was performed for each condition. Eq. 1 is fit to the data. (F and G) GTP displays a competitive mode of inhibition, wherein kcat is independent of GTP concentration, while KM is linearly dependent on GTP concentration. Data are the kcat or KM and SE from fitting Eq. 1 to the data in E. The line in F represents the average of the kcat values: 2.6 ± 0.2 s−1. Fitting Eq. 5 to the data in G, the inhibitor binding constant (KJ,0; Fig. 6) is determined to be 120 ± 50 µM. (H) Titrating GTP against Dgt (∼25 nM) bound to 100 nM Gp1.2 under kcat,app conditions (2 mM dGTP). Data are the mean and SEM of three independent experiments. Eq. 4 is fit to the data. GTP inhibits Dgt–Gp1.2 to completion with IC50 = 310 ± 50 nM and nH = 2.1 ± 0.5.

