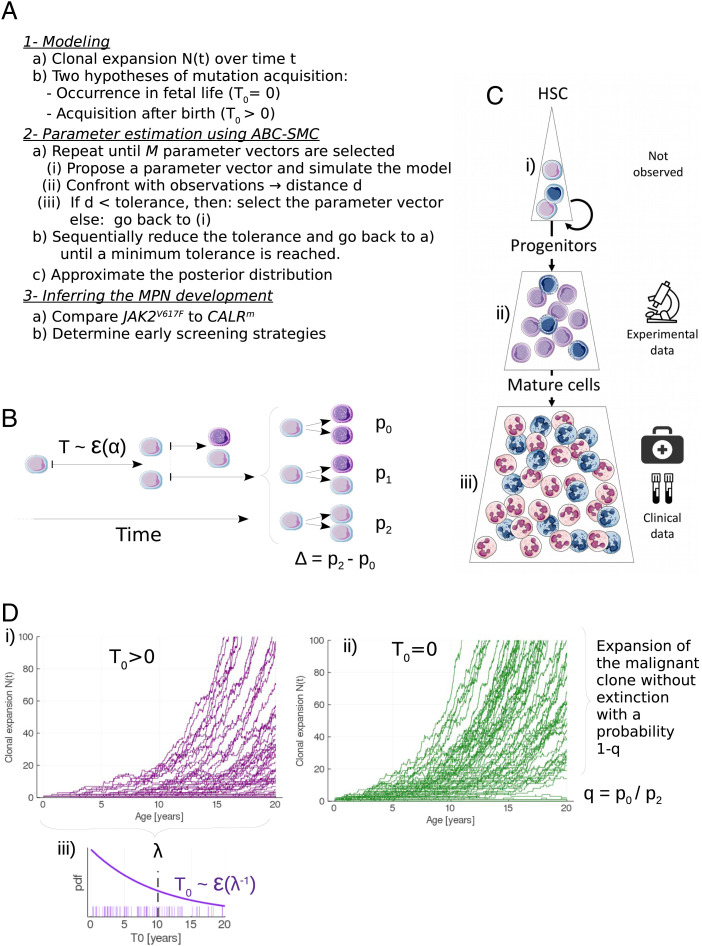
Fig. 1.
Method and model for inferring the development of MPNs. (A) Overview of the method. (B) Modeling the stem cell proliferation dynamics: a given mutated HSC divides after a random time T that follows an exponential law ε(α) of rate α. After dividing, the mutated HSC gives birth to 0, 1, or 2 mutated HSC with probabilities p0, p1, or p2, respectively. Daughter cells, if not HSCs, are progenitor cells (represented in a darker color). On this example, the first division is symmetric, and the division of one of the daughter cells (on the top) is asymmetric. (C) The hematopoietic dynamics can be modeled with three compartments: i) the stem cell pool consisting of a limited number of HSCs that can self-renew and thus drive the long-term clonal expansion; ii) the progenitor cells (CD34+) that arise from HSCs. Our model of MPN expansion is calibrated from measured CF of those cells; iii) a pool of mature cells, whose measure of the VAF in clinical routine can allow the early detection of the mutation. Blue cells are mutated. (D) Modeling the stochastic expansion of the malignant clone from a single mutated cell, where N(t) is the number of mutated HSCs over time t. Two hypotheses are compared for the modeling of the mutation acquisition: either i) after birth (T0 > 0) or ii) during fetal life (T0 = 0). In the former case, T0 follows an exponential law ε(1/λ), of rate 1/λ (where λ > 0 corresponds to the mean acquisition time), whose probability density function (pdf) is represented in (iii). For each scenario 100 simulations are computed, with α = 1/30, Δ = 0.02, q = 1/3, and λ = 10 (for (i) only).

