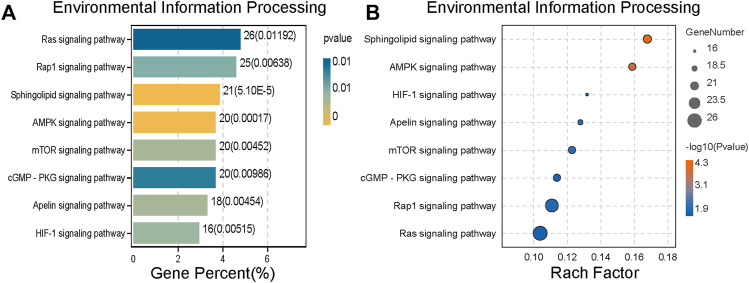
FIGURE 5.
Environmental information processing of differential protein expression. (A) Histogram of Environmental Information Processing ranked by Gene Percent. (B) The bubble chart of Environmental Information Processing is sorted by the Rach factor. The bar chart and bubble chart show the top eight channels of Environmental Information Processing. The more yellow the color, the lower the p value and the higher the credibility.

