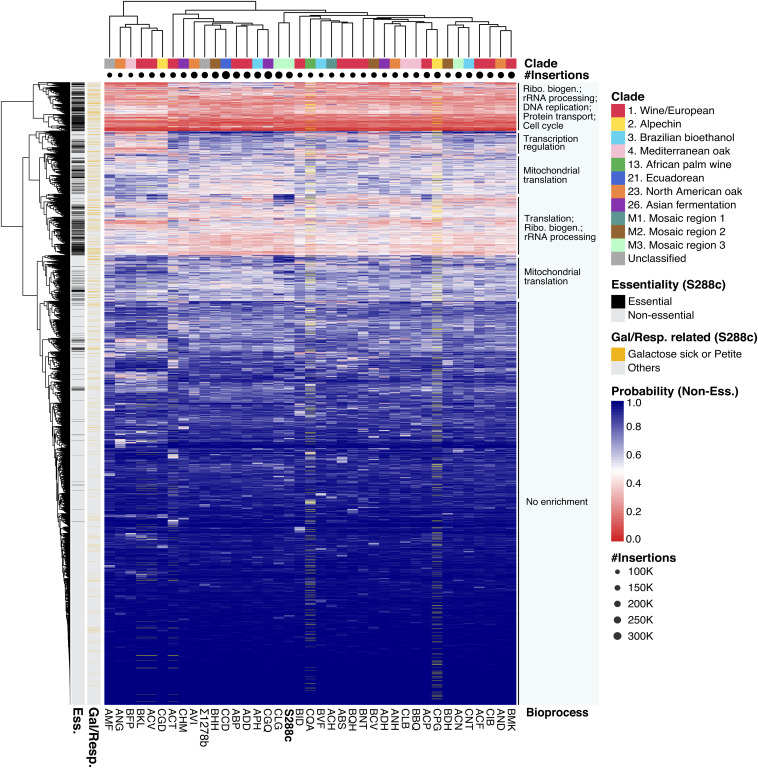
Fig. 2.
Hierarchical clustering of 4,469 fitness predictions across 39 genetic backgrounds. The distance matrix was calculated using the Euclidean distance method. The genetic origin of each isolate was color-coded, and the total insertion numbers per isolate are represented by dot size under the origin color code. Genes annotated as essential in the reference S288C are highlighted in black, and genes annotated as either galactose- or respiration-related are highlighted in yellow on the side bars. Genes within duplicated chromosomes were removed (yellow bars on heatmap). Biological processes that are enriched in subclusters are annotated.

