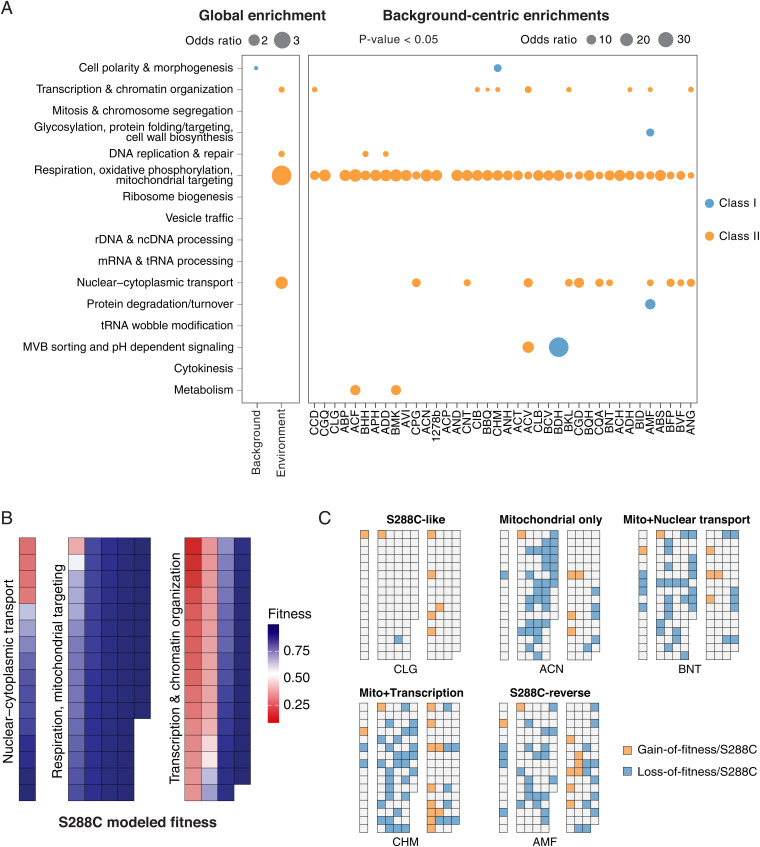
Fig. 5.
Functional enrichments and rewiring for genes with predicted background-dependent fitness. (A) Enrichments across 16 functional neighborhoods defined by SAFE (37). Dot sizes represent ORs between the number of hits in a given neighborhood and the total number of hits detected, with the size of the neighborhood vs. the total number of genes in the dataset as background, using one-sided Fisher’s exact test. Global enrichment for class I (blue) and class II (orange) hits (Left) and strain-centric enrichments are presented (Right). Enrichments with a P < 0.05 are shown. Backgrounds highlighted by dashed lines correspond to example rewiring diagrams in C. (B) Predicted fitness for genes annotated in respiration/mitochondrial targeting, transcription and chromatin organization, and nuclear–cytoplasmic transport in the reference S288C. Genes in different processes are arranged by descending order of the modeled fitness. A detailed annotated version of this diagram can be found in SI Appendix, Fig. S5A. (C) Example rewiring diagrams in other backgrounds compared with the reference S288C. A switch from healthy to sick (loss of fitness) is indicated in blue and a switch from sick to healthy (gain of fitness) is indicated in orange for any given gene in a given background. The diagrams for all 38 isolates are shown in SI Appendix, Fig. S5B.

