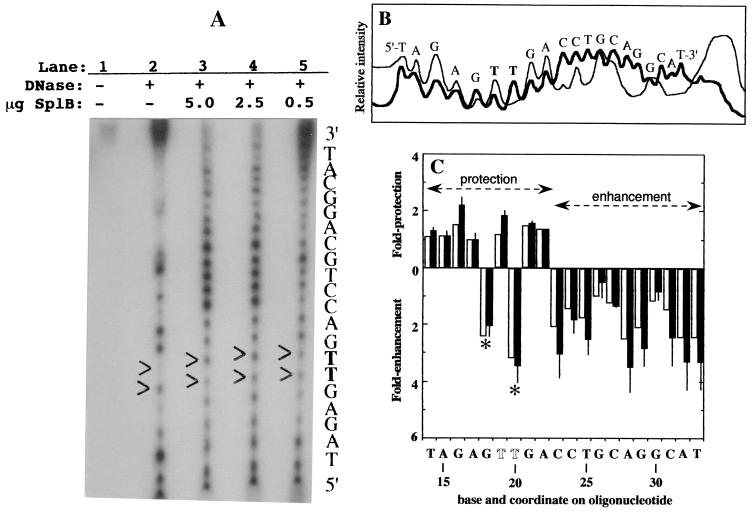
FIG. 4.
DNase I footprinting experiment. (A) Autoradiogram. Lane 1, untreated SP-containing 35-nt oligonucleotide; lanes 2 to 5, SP-containing oligonucleotide after partial DNase I digestion in the absence (lane 2) or the presence of 5.0 (lane 3), 2.5 (lane 4), or 0.5 μg (lane 5) of (10His)SplB. The molar ratios of (10His)SplB to oligonucleotide were 10:1 (lane 3), 5:1 (lane 4) and 1:1 (lane 5). The two thymines corresponding to the position of SP are shown in boldface and indicated on the autoradiogram by arrowheads. (B) Densitometric scan of lane 2 (thin line) and lane 3 (thick line) of the autoradiogram displayed in panel A. (C) Quantitative summary of DNase I footprinting experiments. The protection (upward bars) or enhancement (downward bars) of DNase I digestion at each base on the SP-containing oligonucleotide by binding of 2.5 (open bars) and 5.0 μg (solid bars) of (10His)SplB was determined relative to the unbound oligonucleotide. The positions of the two DNase I-hypersensitive sites within the footprint are denoted by asterisks. The position of SP is denoted by the two open T residues at coordinates 19 and 20. The data using 5.0 μg of (10His)SplB are the averages of two independent determinations; the error bars denote the maximum value obtained.

