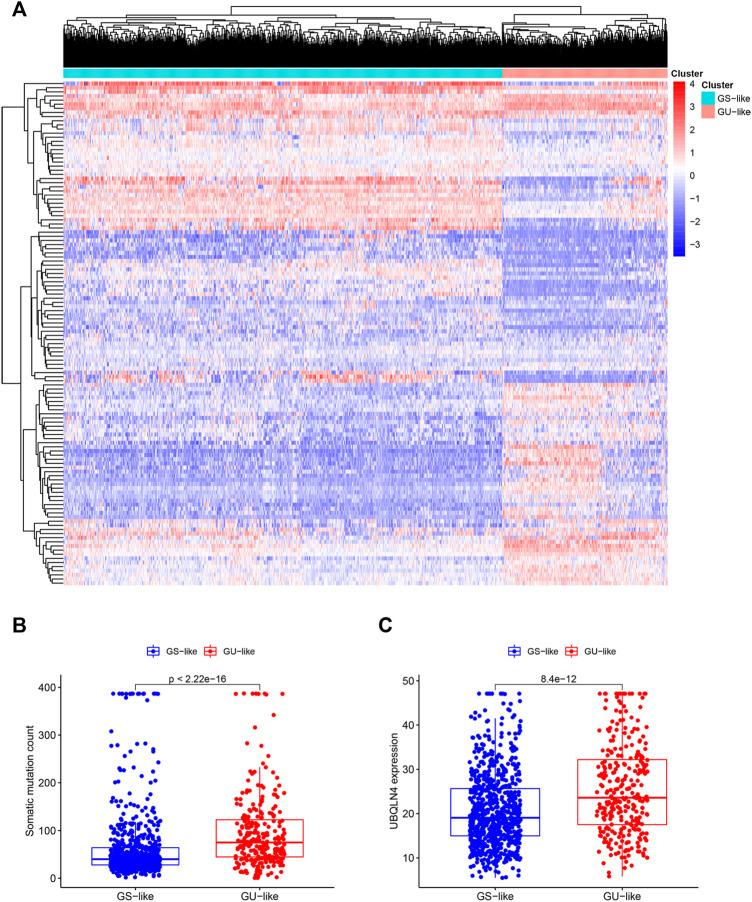
FIGURE 2.
Hierarchical clustering of breast cancer patients and the characteristics between the groups. (A). Hierarchical clustering of 1,066 breast cancer patients based on the expression pattern of 122 candidate genetic instability-derived lncRNAs. The left blue cluster was the GS-like group (n = 774), and the right red cluster was the GU-like group (n = 292). (B). Boxplot of somatic mutations count between two groups. (C). UBQLN4 expression level between these two groups.

