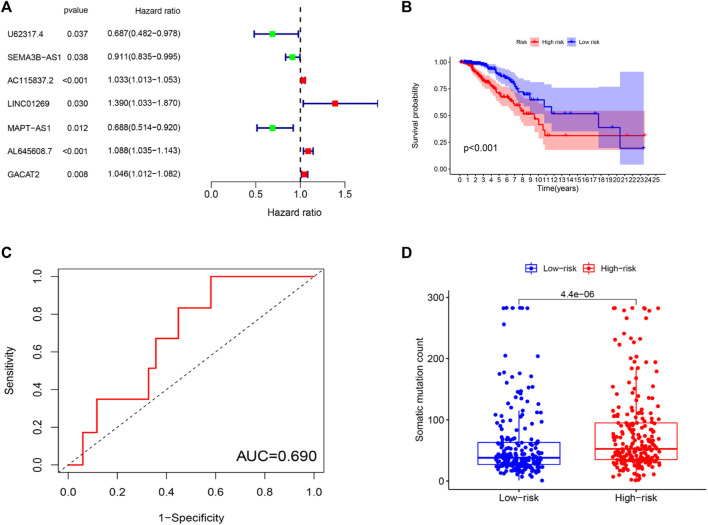
FIGURE 3.
Establishment of genetic instability-related lncRNA signature (GILncRNASig) for prognosis prediction and identification of the predictive efficacy of the model. (A). Forest plot of 7 lncRNAs, which were screened from candidate genetic instability-derived lncRNAs through univariate Cox analysis and Lasso analysis. (B). Kaplan–Meier curves of overall survival of patients with low or high risk predicted by the GILncRNASig in the training set. (C). Time-dependent ROC curve analysis of the GILncRNASig. (D). Boxplot of somatic mutations count between the High-Risk and Low-Risk groups in the training set.

