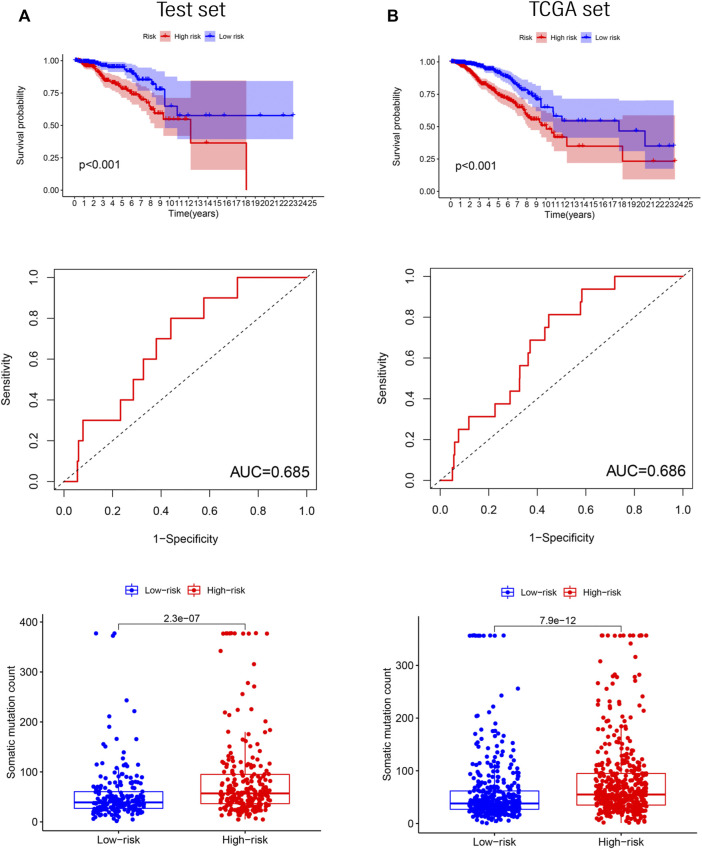
FIGURE 4.
Verification of the GILncRNASig. (A). The Kaplan–Meier curves and boxplot of somatic mutations between low- and high-risk, and the time-dependent ROC curve analysis in the testing set. (B). The Kaplan–Meier curves and boxplot of somatic mutations between low- and high-risk groups, and the time-dependent ROC curve analysis in TCGA set.

